
What is an analytics dashboard?
An analytics dashboard is a built-in tool that tracks, analyzes, and visualizes metrics and data related to in-app communications.
It displays the key business metrics and in-app messaging metrics (e.g., user engagement, delivery rates, conversion rates) over a period of time to show the performance of in-app communications. This allows you to spot trends, identify areas of improvement, and understand user behavior to optimize engagement strategies.
The analytics dashboard allows you to segment and analyze the performance of different channels, campaigns, and user groups based on behavior, demographics, and other factors. Intuitive visualizations, charts, and graphs make it easy to understand data and glean valuable insights at a glance. The dashboard includes a reporting feature, which generates custom reports when you need to share insights and metrics with stakeholders.
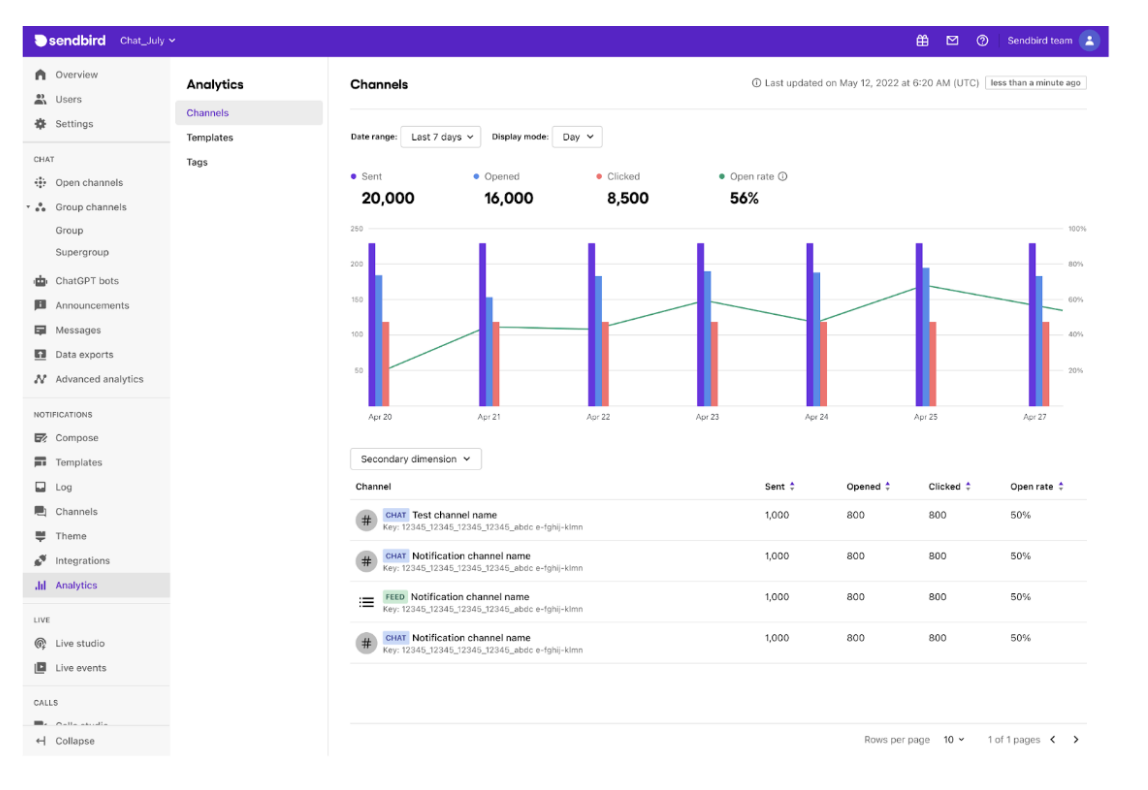
Shown below, the Sendbird Analytics Dashboard can show you the metrics for in-app messaging performance, including sent, delivered, opened, and clicked rates.
The analytics dashboard is where teams can go to understand and improve in-app communications, from support to delivery rates to conversions. This feature is included with Sendbird and other leading in-app communication platforms because it’s an essential tool for tracking in-app messaging metrics, business, metrics, and making your in-app communications the best they can be.

Try Sendbird
Build your in-app communications without the challenge.