
Evaluating developers’ onboarding experience: A UX benchmarking study (Part 1)


In this two-part series, we explore the importance of the developer experience and break down the numbers behind our single-blind study that measured the onboarding experience for users of Sendbird vs. a competitor.
Poor developer experiences will sink even the most innovative and powerful developer tools. This is also why we’re focusing more energy on understanding the developer experience through quantitative and qualitative benchmarking. We’re pleased to share the results of this recent research.
What is DX benchmarking and why did we bother?
Developer experience, or DX, refers to the experiences—both positive and negative—that encompass developers’ interactions with a product (tool or platform), including its APIs, documentation, support and other resources. Much like CX or UX, developer experience encompasses the entire relationship between the developer and the tools or platforms they rely on to do their jobs.
A positive DX makes it more likely for developers to be happy and successful in their job. Happy, successful developers are also more likely to promote the tools and platforms they rely on.
Even though Product, Sales and Marketing teams use and benefit from Sendbird’s products, the day-to-day users of our products are developers. At the end of the day, we want to make sure we’re providing a positive DX throughout the entirety of their journey with our products, from exploration and production to ongoing maintenance.
This was our first time measuring the developer experience with Sendbird, so it made sense to start at the beginning—the stage that typically has the most friction—the developer onboarding experience.
Then we needed something to benchmark against. Though there are several ways to compare developer experiences, we chose to benchmark against a competitor, Stream. This allowed us to systematically evaluate the products’ user experiences apples-to-apples.
Our DX Benchmark study focused on two main components:
- Quantitatively measuring developers’ onboarding experience
- Defining the desirable onboarding experience

Take customer relationships to the next level.
What is a good developer experience for onboarding?
“If it doesn’t build right out of the box, I’m not gonna, you know, I don’t want to fiddle around with it.” – P4
While each developer experiences products differently based on their own unique skill sets and experiences, there are common resources and qualities that make up a positive developer experience.
Resources for a good developer experience
Critical elements to ensure developers have a successful and smooth onboarding experience include:
- Solid onboarding documentation with how-to steps and troubleshooting advice
- Samples of the app for developers to see a working example in action
- A dedicated site with further resources, such as GitHub
As discussed in more detail below, these were the resources we evaluated in our study.
Other resources are nice to have and can take DX to the next level, including:
- Dedicated onboarding support
- Workshops
- Video walkthroughs
Qualities of a good developer experience
No matter what kind of tool a developer is using, there are certain qualities that make for great DX. We measured these qualities quantitatively (detailed in the next section below) through various questions and observable metrics, but it’s important to recognize the high-level values a good developer experience aspires to:
- Velocity: Whether it’s easy-to-find documentation or a simple user interface, getting developers quickly onboarded and using the app is important to maximize value and ensure they want to continue using it.
- Clarity: Every product is unique, but products that clearly follow standards in the industry make learning a new API and interface less of a challenge for developers. Great onboarding resources lessen the learning curve by clearly communicating what to do and being directly useful to the task at hand.
- Ease of Use: The amount of effort required to perform a task is of core interest to developers when choosing a tool. The product and instructions must be simple for users to follow, so that developers can implement it without requiring additional support or resources.
To measure these qualities, we chose the most widely used standardized questionnaires for evaluating perceived usability: The After Scenario Questionnaire measured task-based user satisfaction immediately following the onboarding scenario, and the System Usability Scale gauged developers’ overall perceptions of the onboarding experience. Finally, the resource ratings questions we developed were based on existing questionnaires for evaluating technical documentations, and measured the ease of use and clarity of the resources.
The results: Sendbird’s DX for onboarding vs. the competitor’s
Let’s dive into how we designed the study and review the quantitative results.
Participant demographics
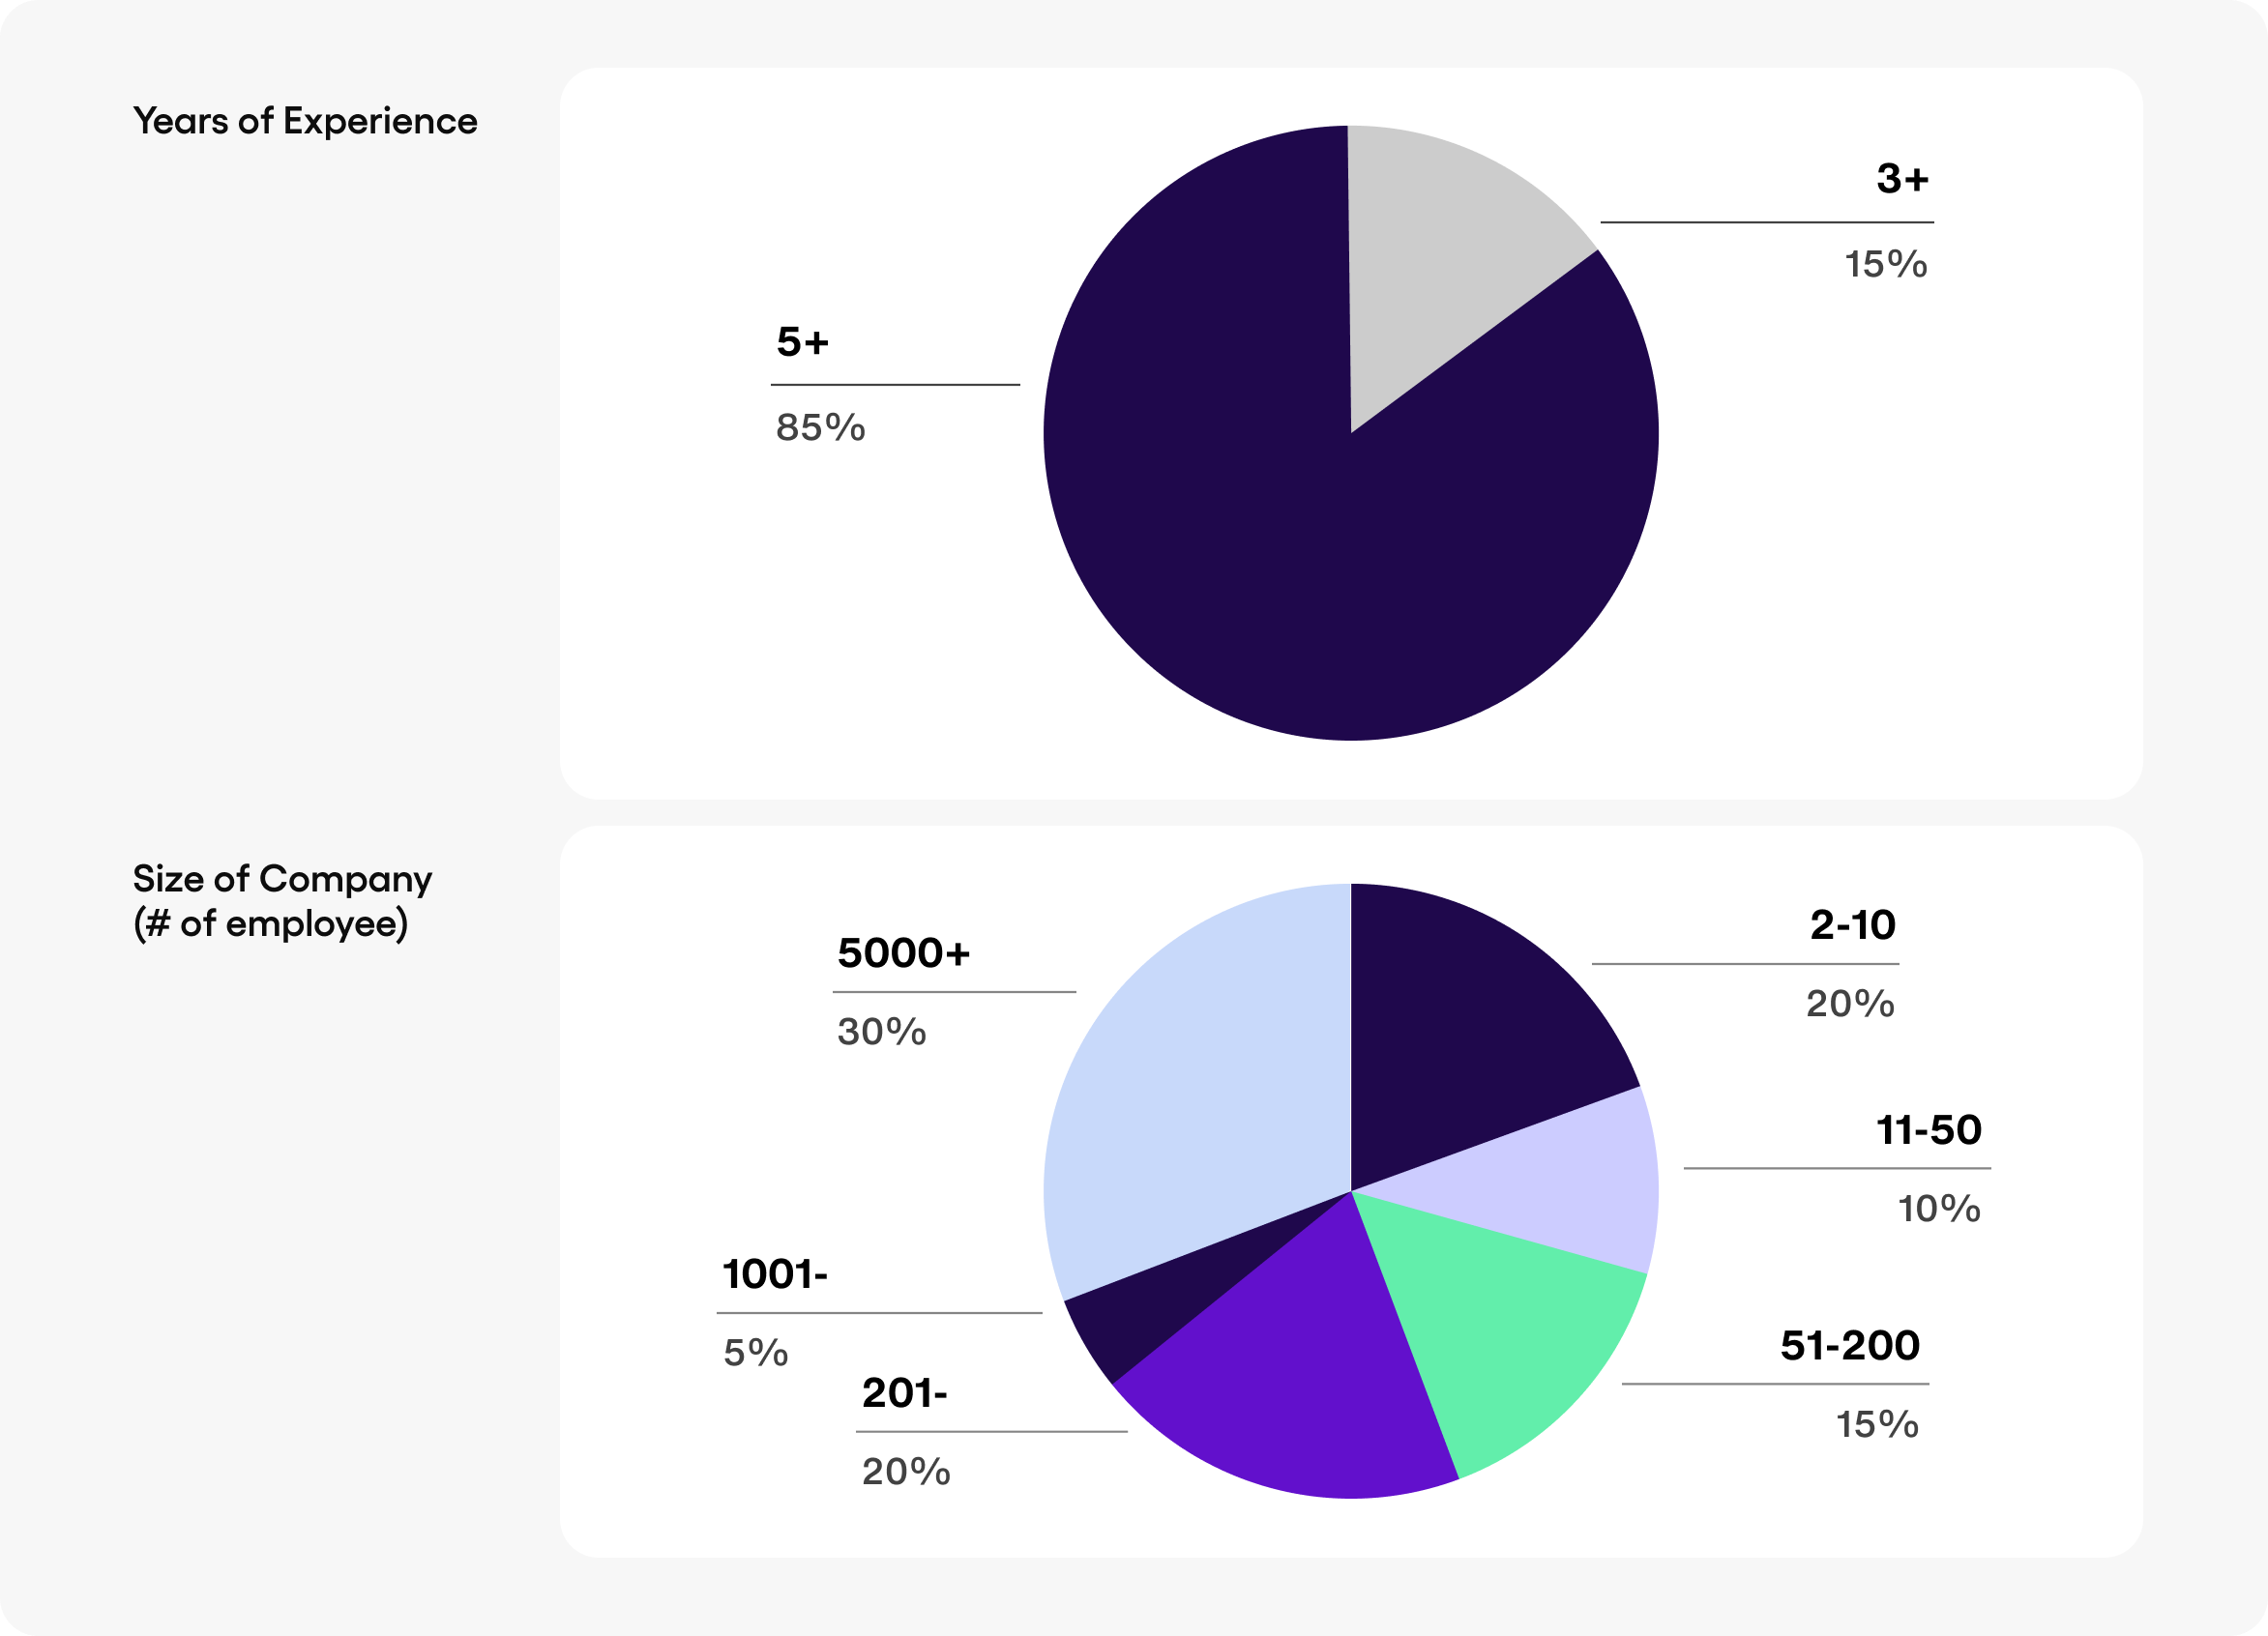
Since this was a developer experience study, our 20 participants were an assortment of front-end and full-stack developers at an Enterprise or SMB-sized company. Each participant had a minimum of 3 years of software development experience and had never used Sendbird or Stream before.
Besides their experience, the main requirement was that they used the target platforms—Android, iOS, and React—in their current role. The breakdown was as follows:
- 5 Android developers
- 5 iOS developers
- 10 React developers
Method
This was a single-blind study, meaning participants didn’t know that Sendbird was the one conducting it. This helped ensure objectivity in our participants.
The study took place for 90 minutes, with participants experiencing both Sendbird and Stream within that time. To start, we randomly selected half the participants to test Sendbird’s onboarding, while the other half began with Stream. They were given 30 minutes to complete the onboarding tasks however they saw fit, and then were given three surveys: an After Scenario Questionnaire (ASQ) immediately after the task, an evaluation of key resources and a system usability scorecard to measure overall satisfaction.
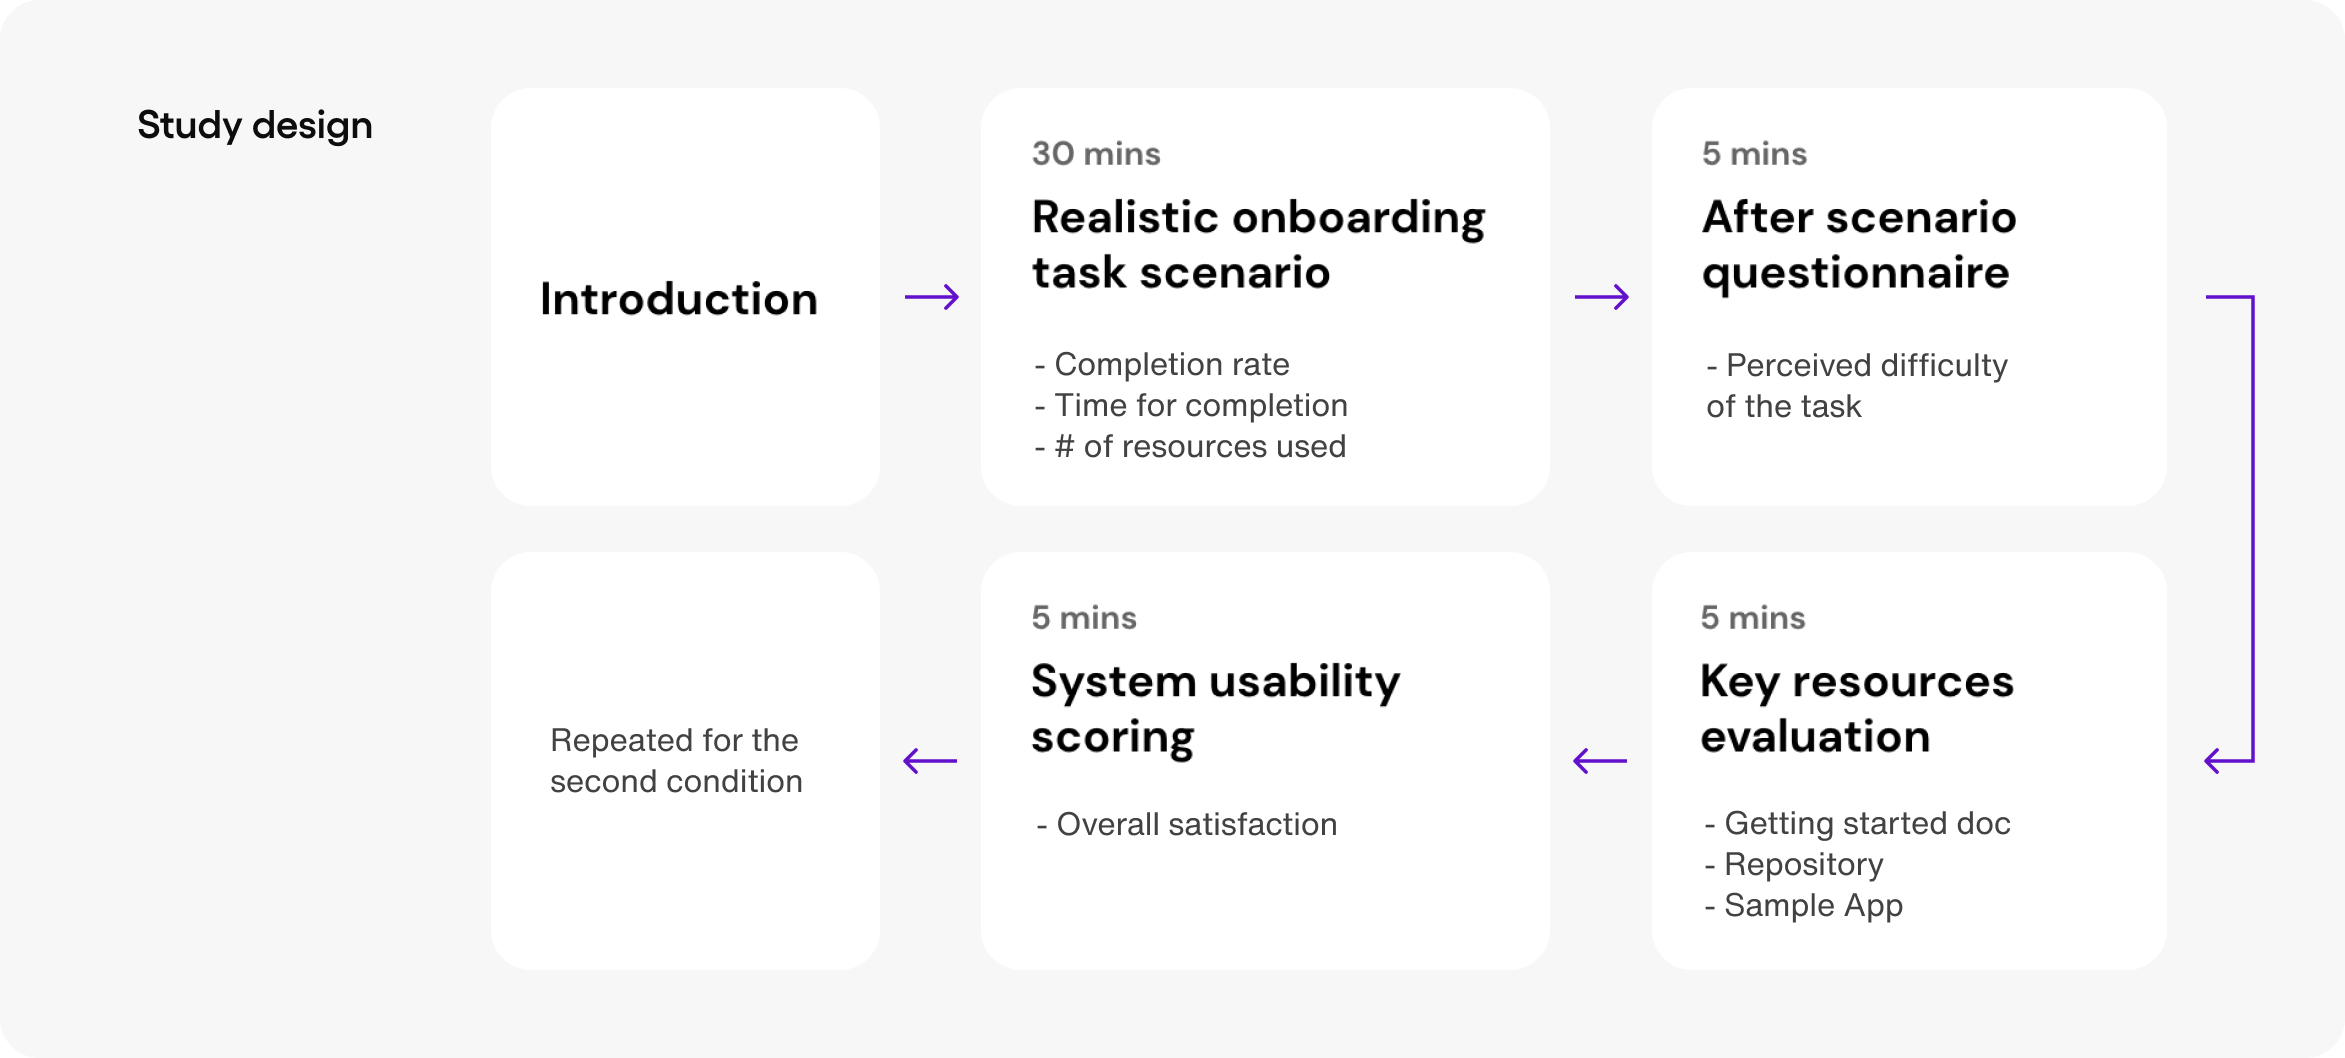
Once they completed the first onboarding task and surveys, they then moved on to the next product and repeated the same steps.
The results by the numbers
We’re going to take a look at the developers’ experience based on the quantitative data. To see what the developers had to say about the experience, check out our follow-up article with the qualitative results.
First, let’s look at the observable behavioral metrics—i.e. what objectively happened when developers used Sendbird versus Stream. These metrics are a good indication of the velocity of the user experience.
Task completion rate
Of the 8 essential tasks that made up the 30-minute onboarding challenge, how many did each developer successfully complete in the time limit, and how long did each step take?
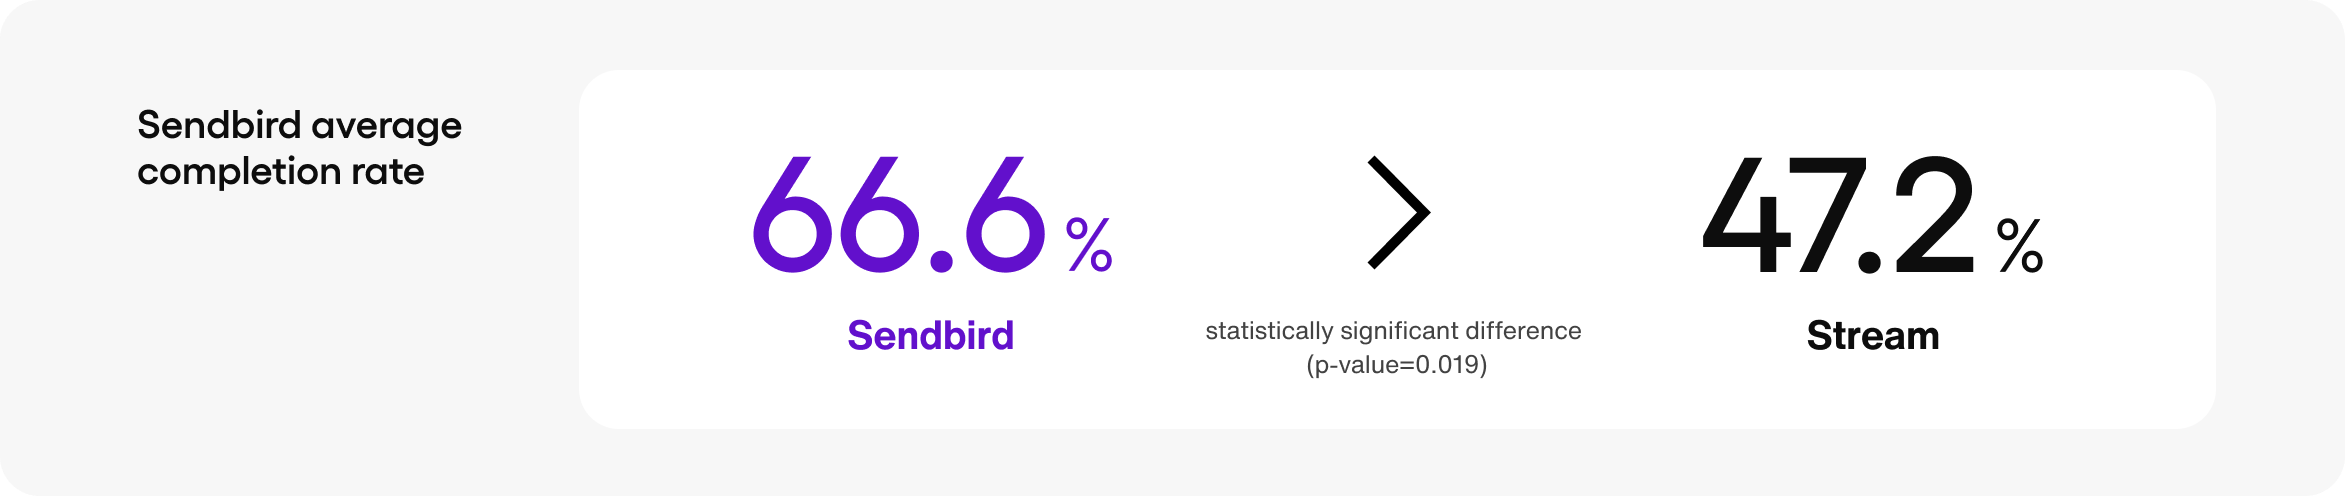
Overall task completion rate
Nearly ⅔ of the Sendbird tasks were completed in the allotted time by the developers, while just under half of the Stream tasks were completed in the allotted time by the developers.
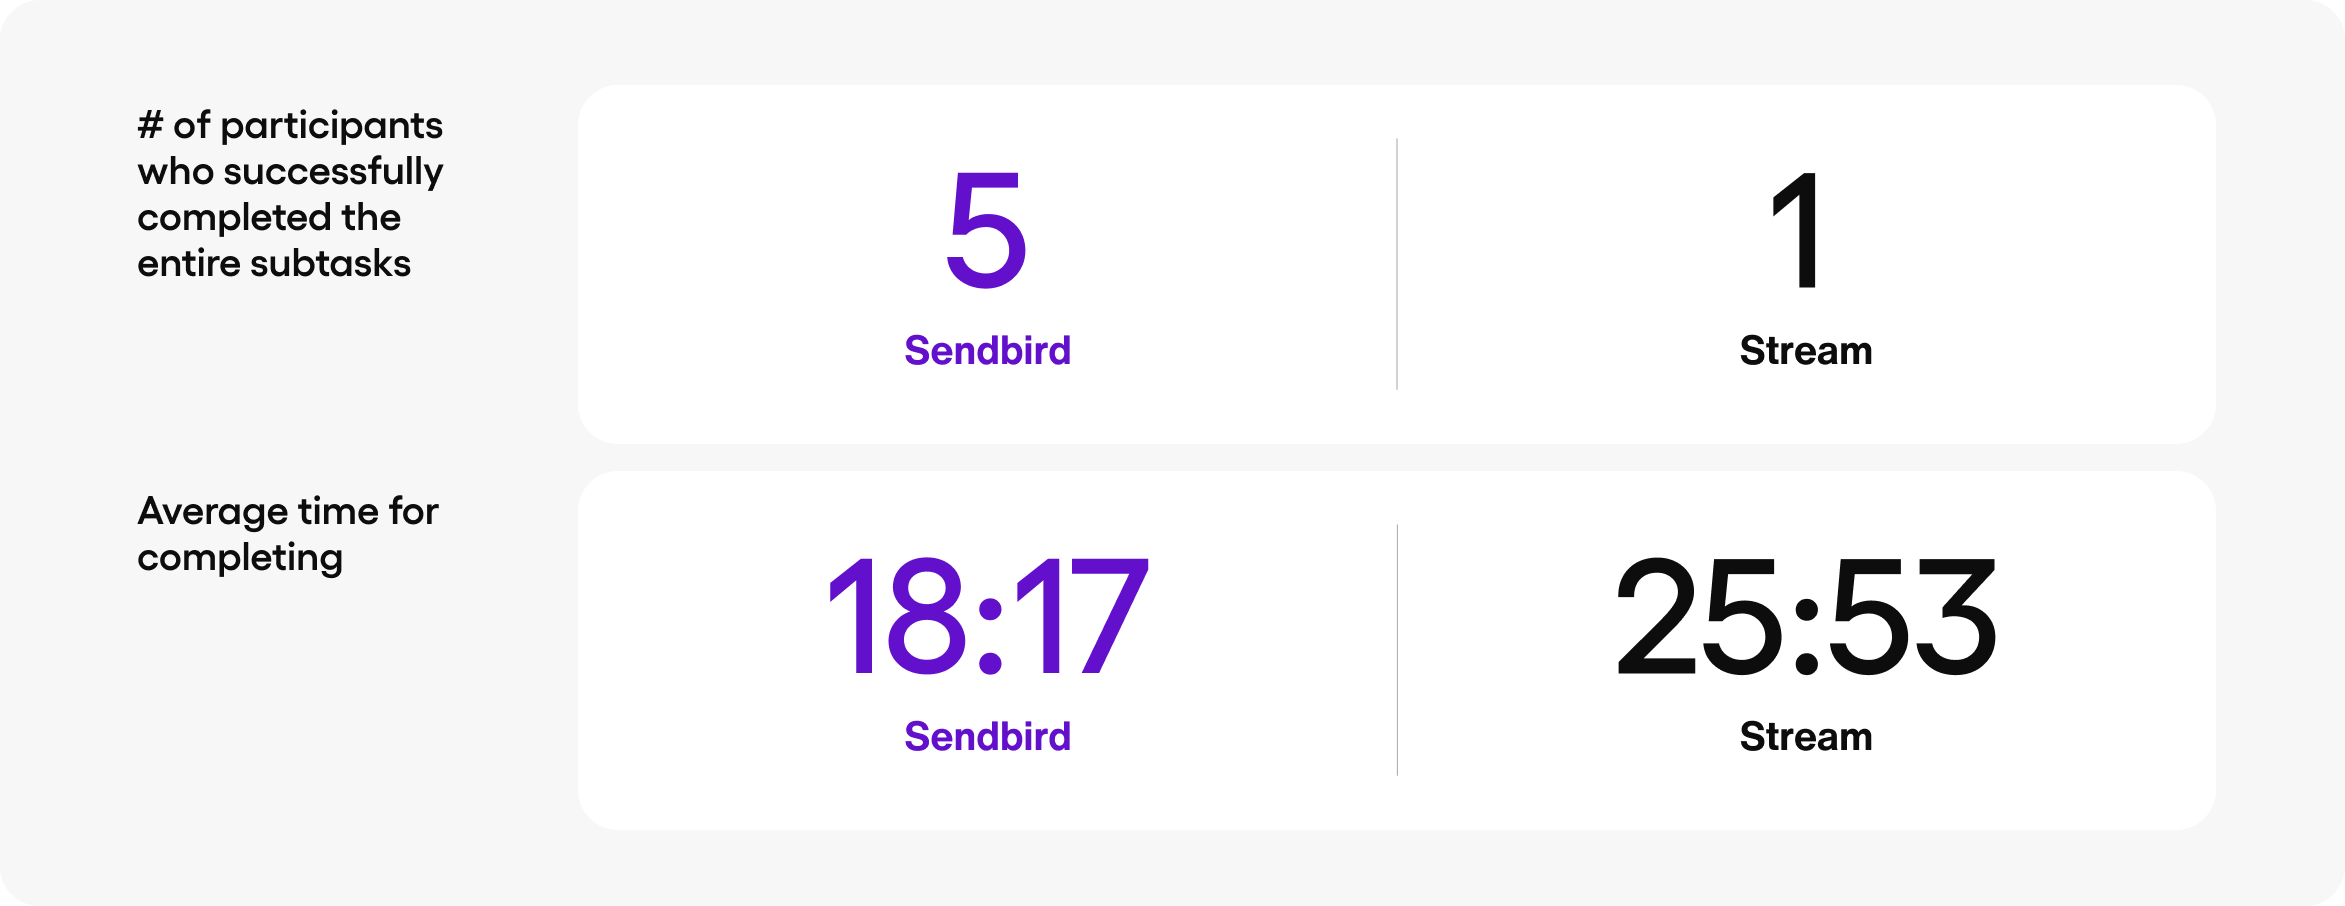
Full completes
When we looked at how many participants completed each product’s onboarding, 5 Sendbird users successfully completed all the subtasks in an average time of 18 minutes and 17 seconds. For Stream, 1 user successfully completed the entire set of subtasks in 25 minutes and 53 seconds.
(Note: The completion rates are relatively low due to the study design, which limited the task time to an artificially low 30 minutes and a total session to 90 minutes to avoid fatigue.)
The user ratings
After each participant completed their 30-minute onboarding challenge, they were asked to rate each product.
After-scenario questionnaire
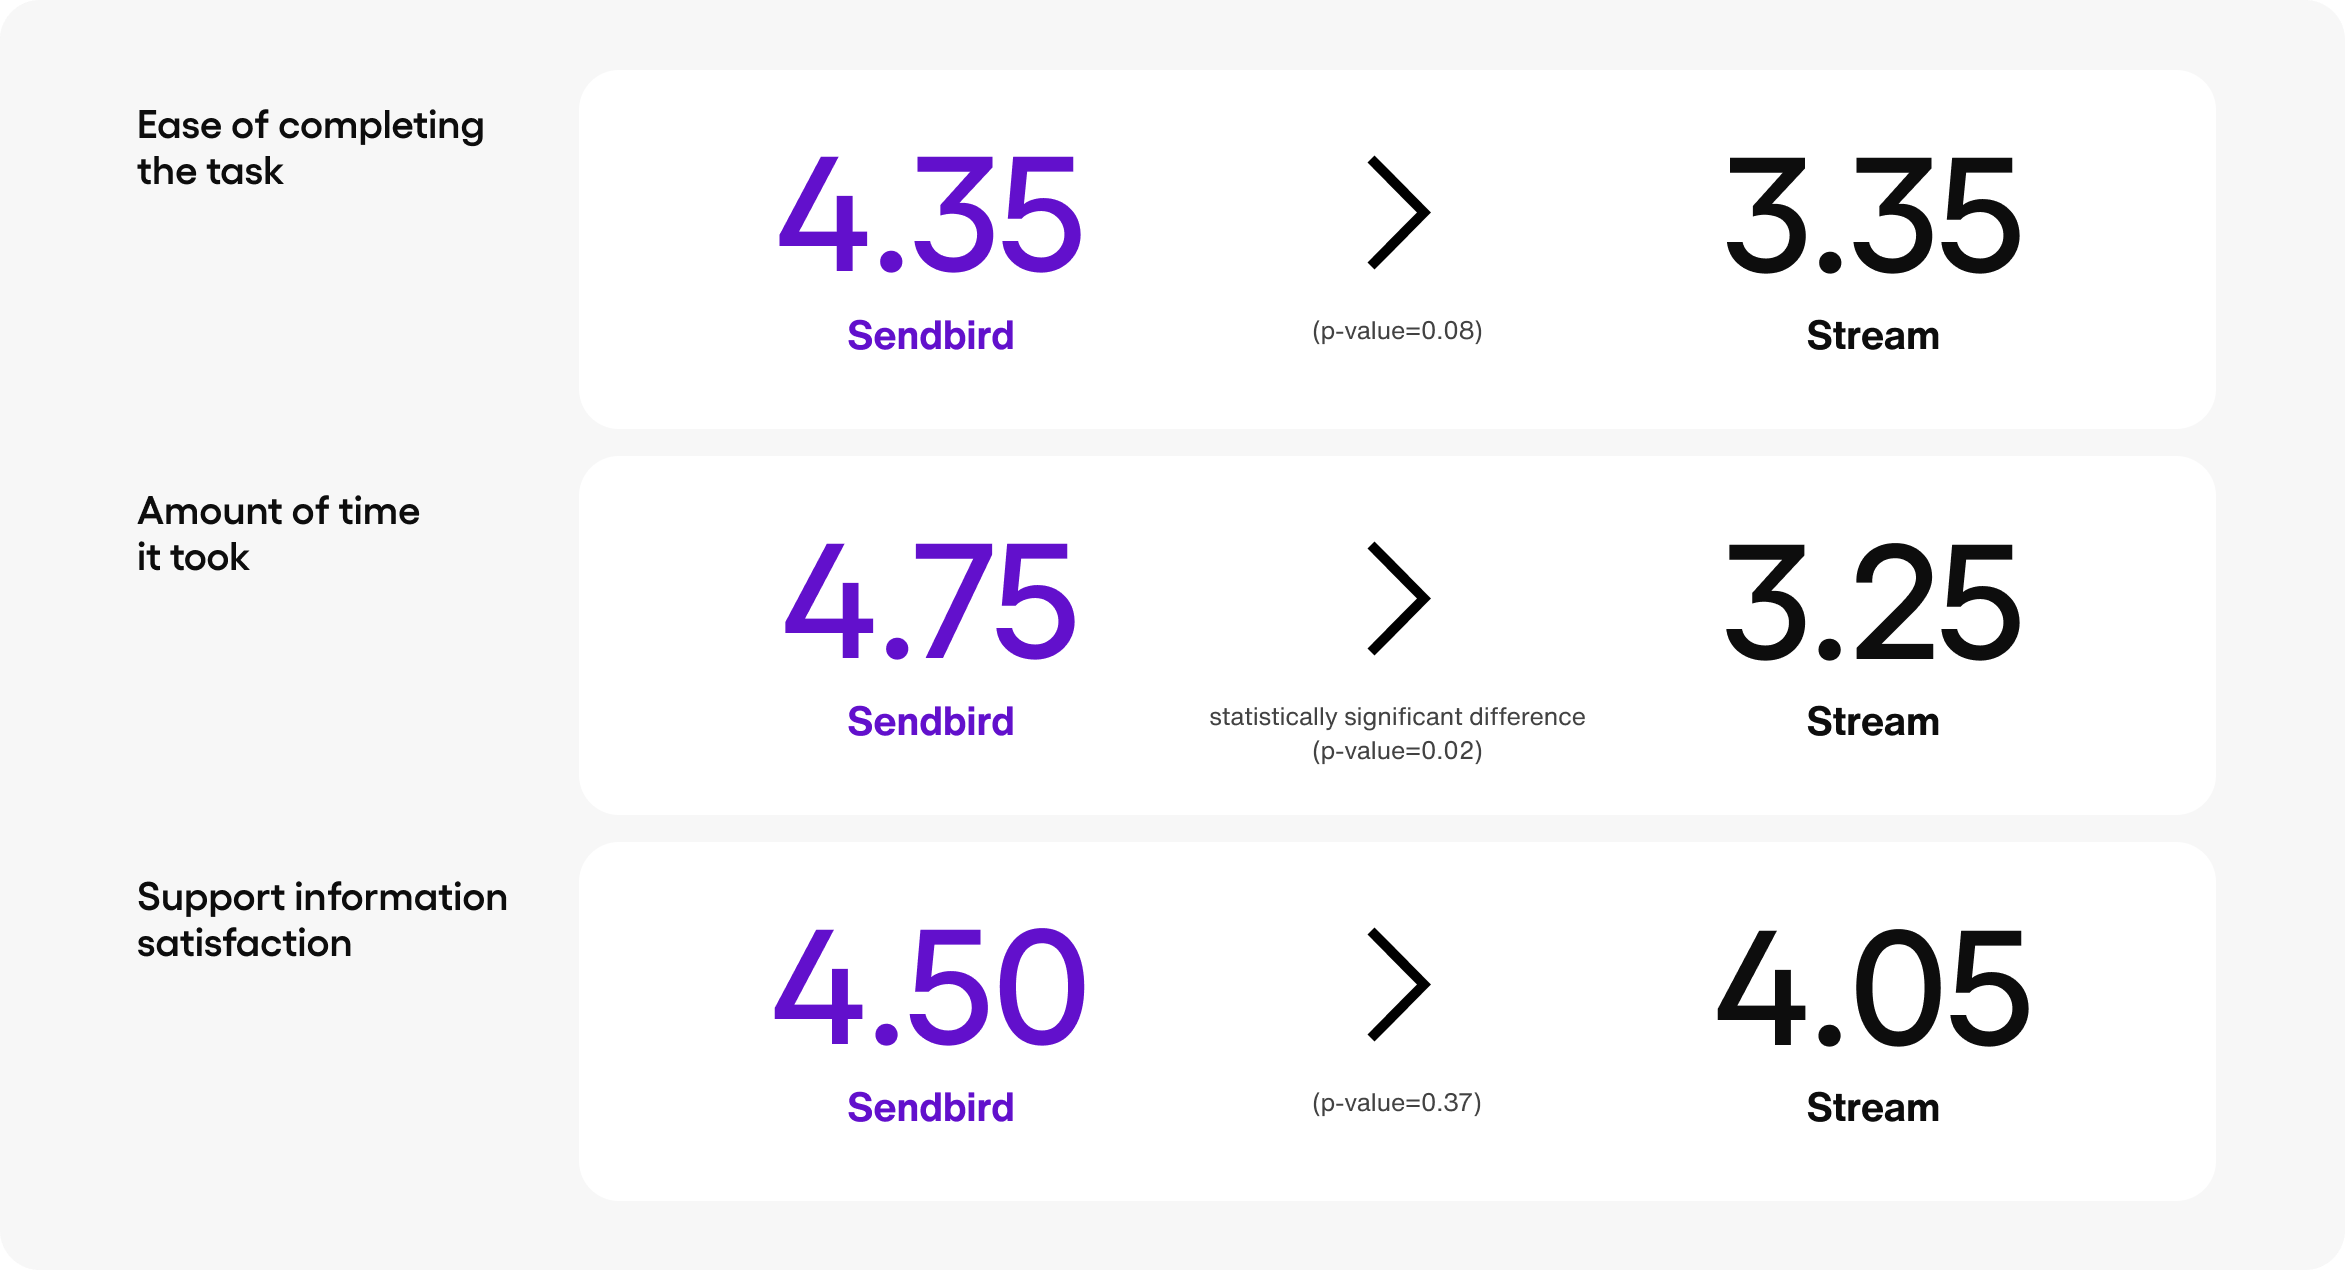
Immediately following each onboarding experience, participants were asked to rank three qualities of the experience on a scale of 1 to 7, with 1 representing strong dissatisfaction and 7 representing strong satisfaction:
- How satisfied were you with the ease of completing the task?
- How satisfied were you with the amount of time it took to complete the task?
- How satisfied were you with the support information [samples, documentation] provided to complete the task?
Both Sendbird and Stream fell within a similar range, with Sendbird ranking higher in all three areas. The biggest difference was in the amount of time it took, with users being markedly more satisfied with the speed of Sendbird’s onboarding.
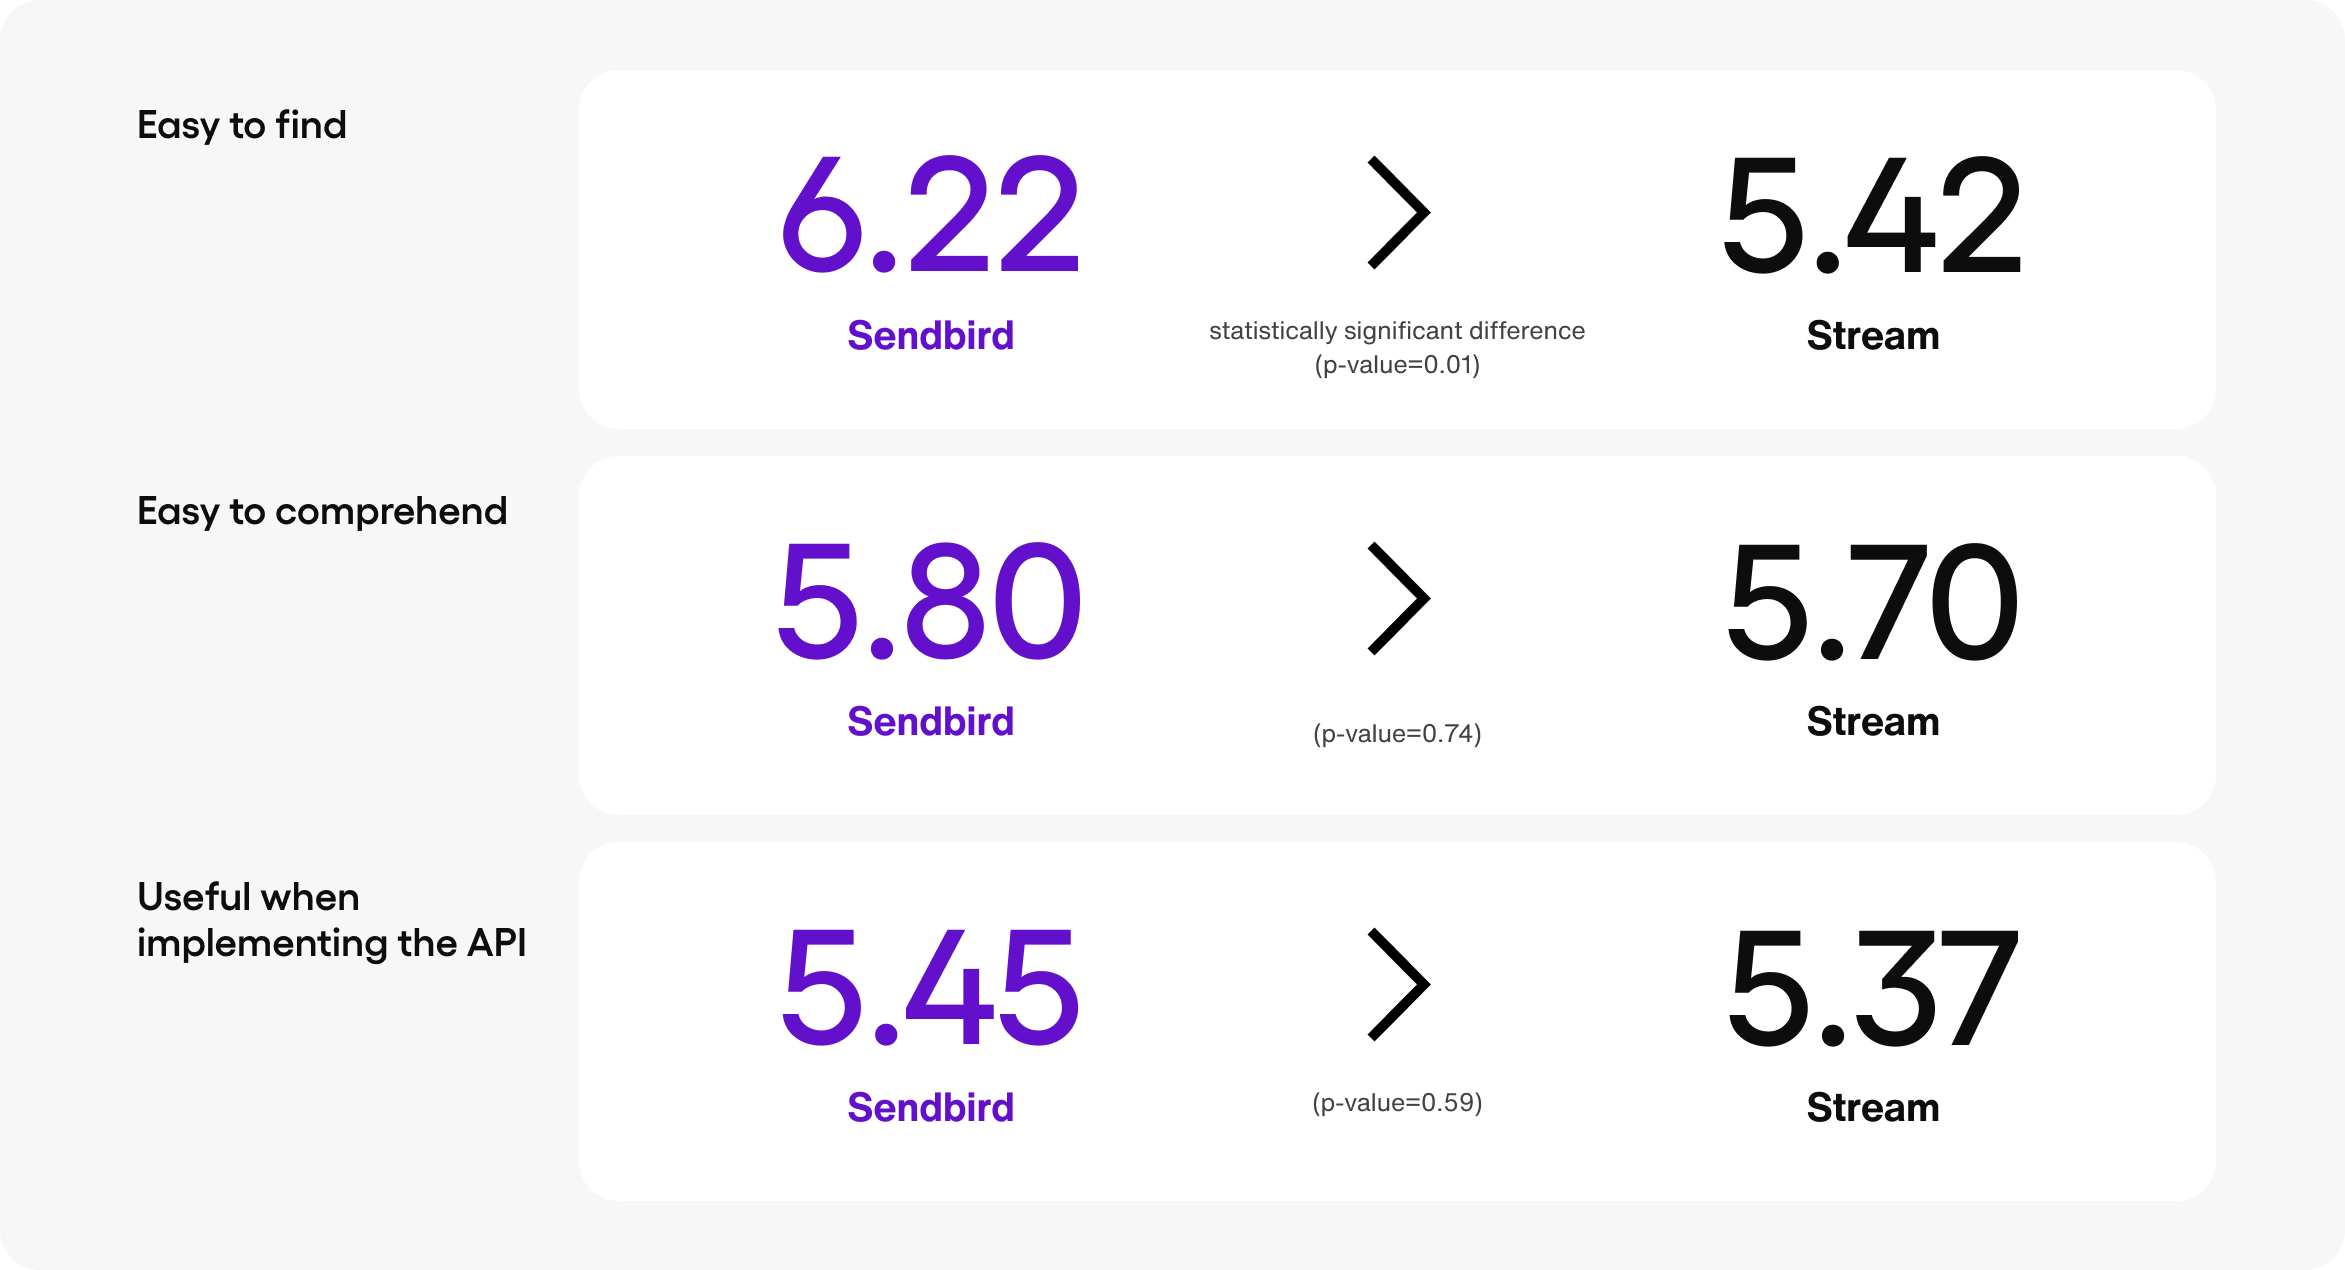
Resource ratings
Developers rely on solid documentation and examples to implement new APIs in their app. Following the same scale of 1 to 7, participants were asked to measure the ease and usefulness of the three provided resources; the getting started documentation, the sample app, and GitHub repository:
- How easy was the resource to find?
- How easy was the resource to comprehend?
- How useful was the resource when implementing the chat API?
Users ranked Sendbird higher for all three resource ratings questions. Most notably, there was a significant difference in the score for easy to find, meaning it was clearer for participants to locate the resources they were looking for using Sendbird’s resources versus the competition. Since clearly indicating paths to different resources is critical for developers to decide where to begin, and considering that developers tend to search around and use multiple resources during the onboarding process, these findings indicate that the superior findability of Sendbird’s resources has positively impacted participants’ completion rate and user satisfaction during the onboarding scenario.
System usability scale (SUS)
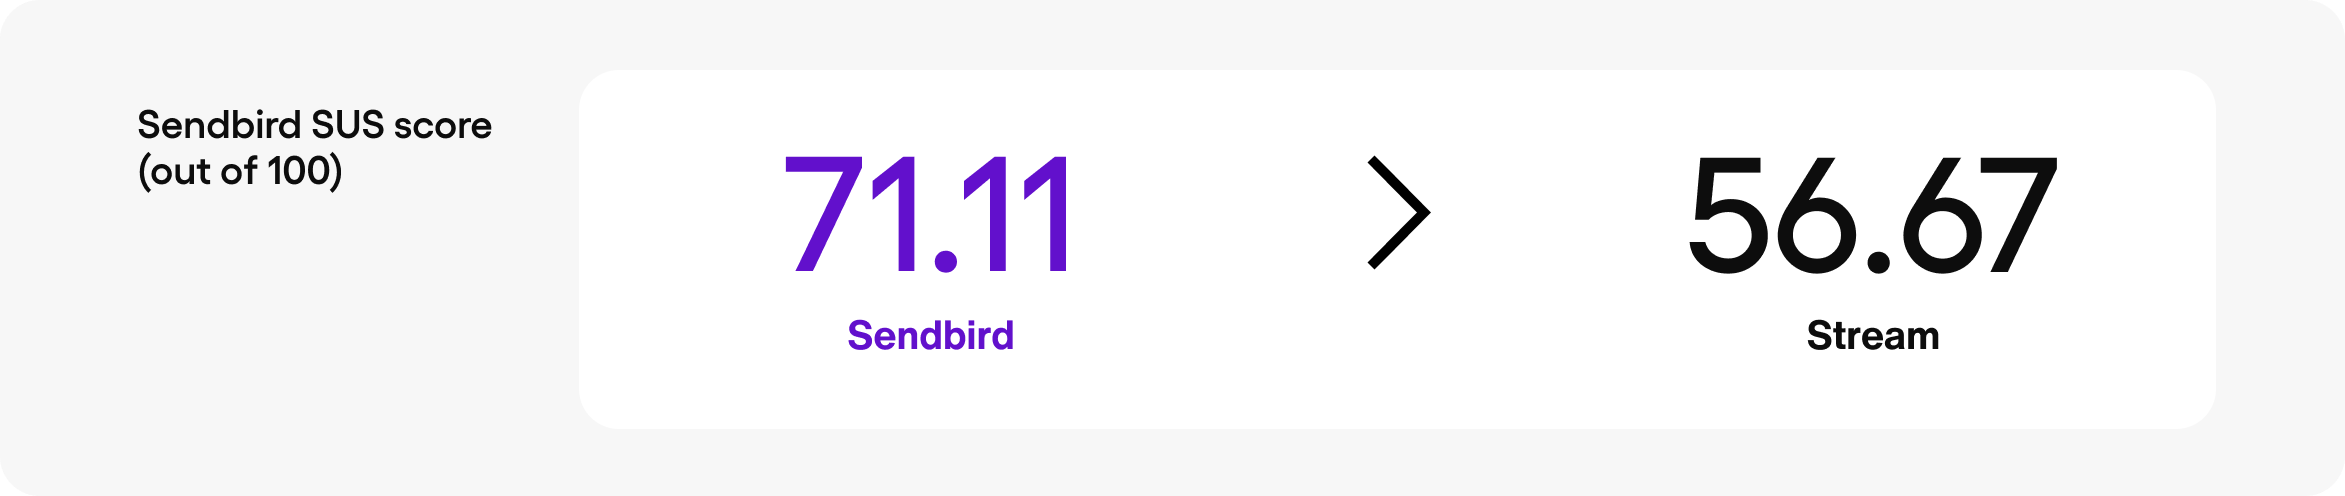
Usability is one of the core components of the developer experience. Participants were asked to fill out a system usability scale to measure perceived quality and ease of using the products. SUS surveys provide a score out of 100, with 100 being the best imaginable user experience. Following the literature, we modified the standard template to be as relevant as possible to the developer’s experience (Lewis & Sauro, 2018).
Based on the responses, Sendbird edged out Stream with a usability score of 71.11 versus 56.67. When compared to the conventional SUS score range for consumer products, a score of 71 falls within the acceptable usability range, while 56.67 falls within the higher end of the unacceptable range.
Preferred onboarding experience
Perhaps the most important question was, which onboarding experience and product did the developers prefer?
Of the 20 participants, 17 chose Sendbird and 3 chose Stream, showing that a significant majority (85%) of developers preferred Sendbird’s onboarding experience.
Among those that chose Sendbird, participants noted it was easier to follow and has more clarity compared to Stream.
What’s next?
The quantitative data shows that Sendbird’s onboarding experience consistently outperformed Stream across the board. But when it comes to DX, the numbers don’t tell the whole story.
In our next article, we’ll dive deeper into the developer experience of onboarding with Sendbird and Stream by evaluating the qualitative, anecdotal feedback from the participants that was captured in real time during the study.