
What is Net Promoter Score (NPS)?


When you interact directly with a customer, it’s easy to tell whether they are impressed with your service or not. If they leave the conversation smiling or explicitly express their gratitude over chat, there’s a good chance they will be a repeat customer or leave a positive review.
But how do you know whether this is happening consistently across your business?
That’s what NPS (Net Promoter Score) is all about. A pioneer of customer loyalty marketing developed the NPS metric, a standard that allows customer service managers and business leaders to gauge progress over time.
In this post, we will discover what NPS measures, how to calculate your score, and how you can improve your overall customer experience.
Net Promoter Score definition
NPS, or Net Promoter Score, is a metric that helps you to predict customer loyalty based on customer satisfaction data.
You can also use the NPS metric to:
Track customer satisfaction over time
Predict customer retention vs. subscriber churn
Estimate how many of your customers are likely to become brand advocates
Make forecasts on business growth
On a statistical level, NPS measures the proportion of your customers who are happy to recommend your product or service to someone they know. Except it’s a little bit deeper than that.
Your NPS takes into account three groups of people:
Promoters – Customers who are likely to recommend your product or service to others and remain loyal to your brand.
Passives – Customers with a neutral viewpoint who are unlikely to make a recommendation. Some will become repeat customers, but most will be open to offers from your competitors.
Detractors – These unhappy customers may warn others against using your product or service. They are unlikely to do business with you again unless they don’t have another option.
The calculation for NPS compares the percentage of people in each group. This means you get a better overall sense of your customer service performance.
Why you should use NPS
In theory, you could simply look at the raw data from surveys to gauge the mood of your customers. However, trying to extract meaningful insights from customer feedback can be a time-consuming task.
NPS makes it easier to track your progress by summarizing customer satisfaction in a single figure between -100 and +100. In a simple line graph, you can see whether your service is improving or declining over time.
Moreover, you can calculate your Net Promoter Score based on answers to a single question: “On a scale of 0–10, how likely are you to recommend [brand/product] to a friend or coworker?”
Consequently, you have a better chance of convincing people to rate their experience than a survey containing multiple questions.
Another advantage of NPS is its standardized measurement of customer satisfaction across industries.
The metric was developed in 2003 by the marketing thought leader Fred Reichheld, a partner of the global consultancy firm Bain & Company, Inc.
Since then, NPS has been adopted by countless businesses worldwide — meaning you can now find solid benchmarks for pretty much any vertical or niche.

Virgin Mobile UAE improved their CSAT with Sendbird Desk.
How do you calculate Net Promoter Score (NPS)?
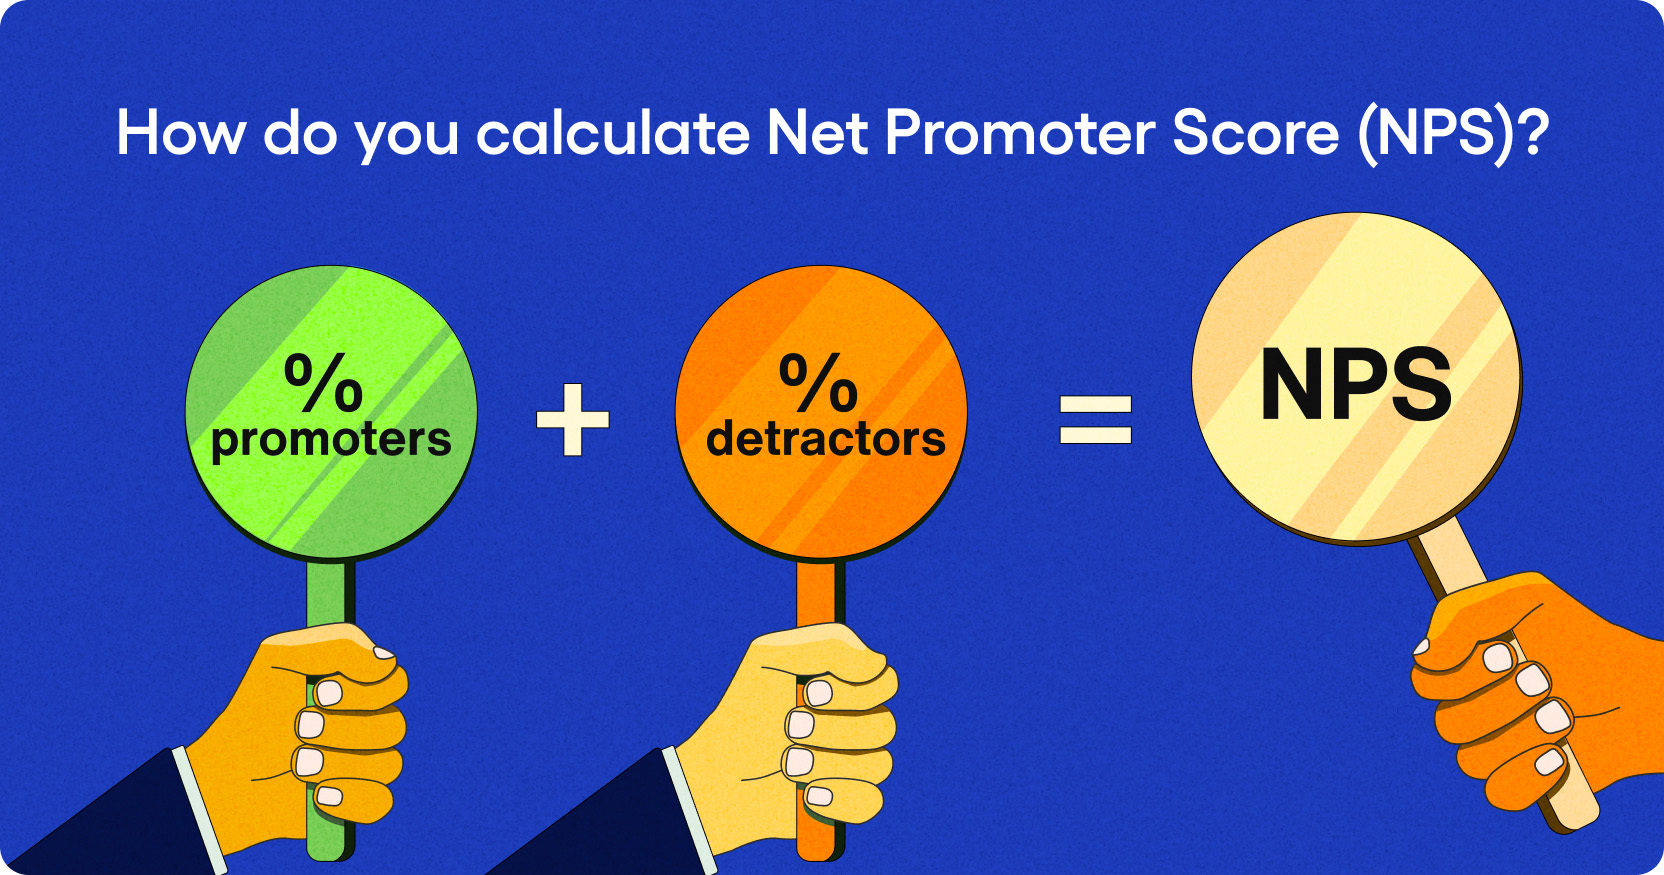
The equation for calculating your Net Promoter Score is quite simple:
% promoters – % detractors = NPS
Passives are left out of the formula because they don’t have any significant net impact on your business in either direction.
While the math is very basic, you do need to have the right kind of data to make it work. Your customers must also be sorted into Promoters, Passives, and Detractors based on their responses.
When you ask people to rate their experience on a scale of 0–10, the groups look like this:
Promoters: 9–10
Passives: 7–8
Detractors: 6 or lower
These figures have not been plucked out of the air. Research shows that 80% of business referrals come from Promoters, while only 50% of Passives will become repeat customers.
What is a good Net Promoter Score?
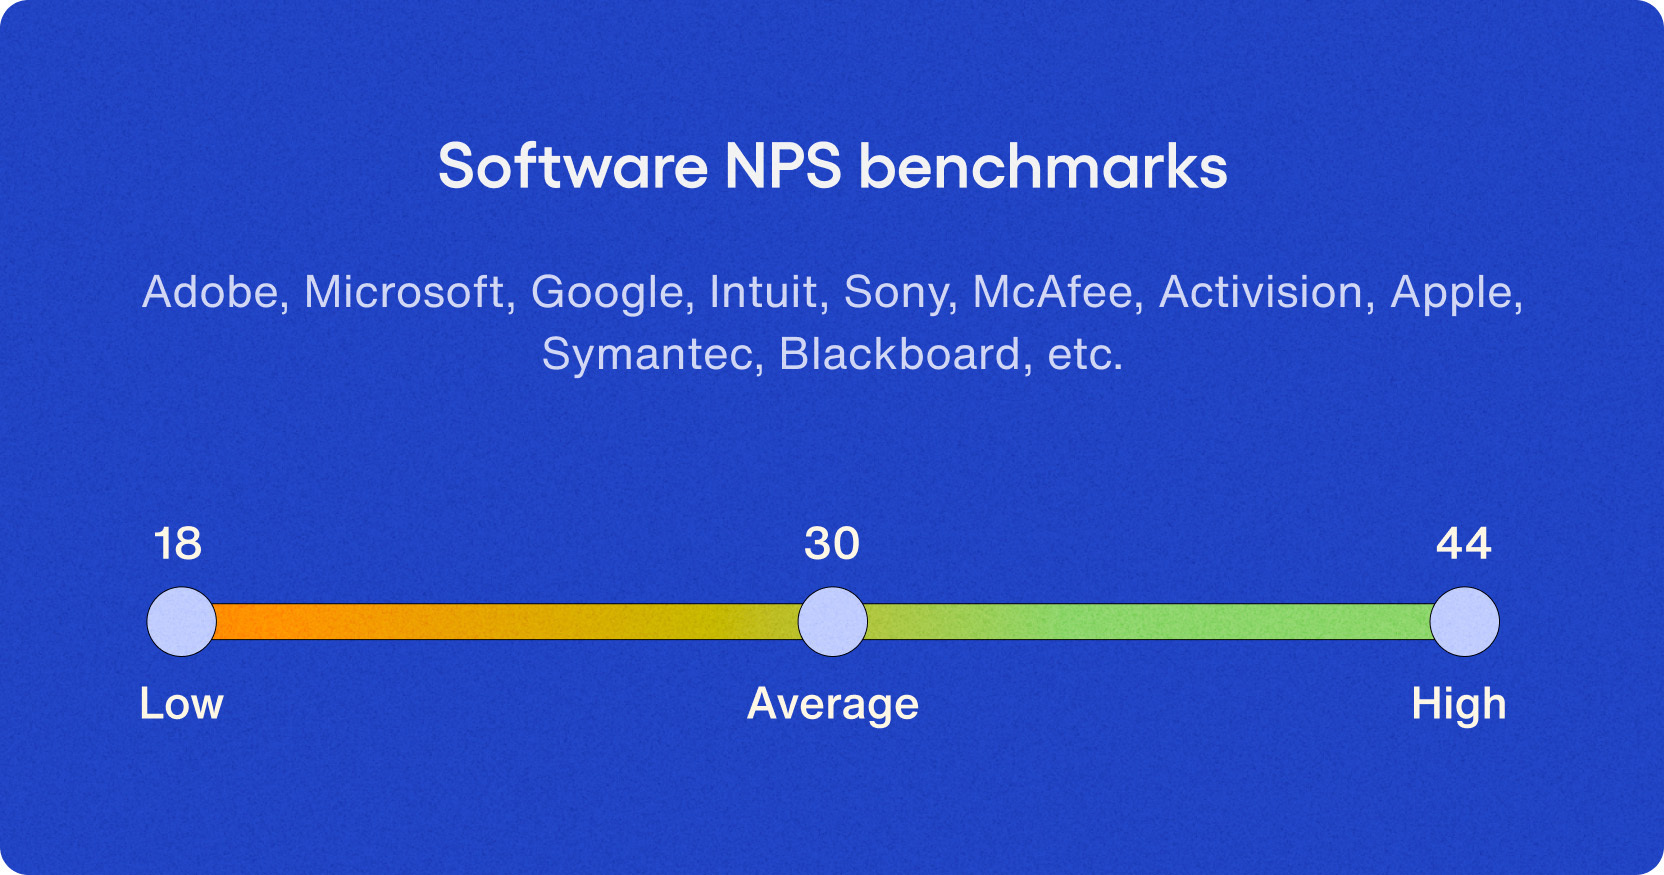
The Net Promoter Score you should aim for really depends on the industry you’re operating in. Benchmarks range between 30 and 50, with a few outliers at both ends of the scale.
As a general rule, anything above 50 is excellent, while scores below 20 suggest that improvement is needed.
But here’s a comprehensive breakdown:
-100 to 0 – The majority of your customers have a bad experience, and your business is likely to be suffering from negative word of mouth
1 to 30 – Scores in this range are acceptable, but you should probably be striving for a higher score
31 to 50 – The majority of successful companies sit somewhere in this range; you generally need to put some effort into customer service to achieve this kind of score
51 to 70 – Only businesses that deliver great customer service can hope to achieve a score in this range, and they tend to benefit from great word-of-mouth marketing
71 to 100 – If you can achieve anything above 70, you should be running seminars on customer service
Again, these ranges only provide a general guide. If you want to know how your score stands up to the competition, look up benchmarks within your specific industry.

[FREE TOOL] How does your app's engagement score compare to industry standards?
How to create an NPS survey
One reason why NPS is so popular is that it can provide valuable insights from a single type of data.
You can reduce the number of survey questions you ask, making it easier for customers to provide feedback. In turn, you should find that a larger proportion of your customer base is willing to respond.
That said, you still need to put some thought into your surveys to maximize the number of responses you receive and the quality of that data.
Relational or transactional
The first step is to decide what kind of survey you want to run.
Relational surveys are regular check-ups sent out to existing customers every quarter or every year. They are designed to give you a consistent baseline so that you can track changes over time.
Transactional surveys are the type you send out when a new customer makes a purchase or when someone interacts with your customer support team. These surveys are designed to evaluate your service at individual points in the customer journey.
If you are going to adopt NPS as a key metric, it’s a good idea to run both kinds of surveys in tandem.
Once you have decided which type of survey you will create, you need to consider what content you want to include.
The NPS question
Obviously, we need to include one primary NPS question.
You don’t have to stick with the exact wording, but it should be something like this:
On a scale of 0–10, how likely are you to recommend [our company] to a friend or coworker?
If you want to be more specific, you can change it to:
On a scale of 0–10, how likely are you to recommend [our product / service] to a friend or coworker?
If you’re building a transactional survey or trying to pinpoint a specific part of the customer journey, you could make your question:
Based on your recent experience shopping with us, how likely are you to recommend [our company / product / service] to a friend or coworker?
Or
Based on your recent interaction with our support team, how likely are you to recommend [our company / product / service] to a friend or coworker?
You could also consider changing the subject of the question. For instance:
On a scale of 0–10, how likely are you to recommend [our product / service] to someone in your business network?
The possibilities are endless. Just stick with this formula to ensure your data is unbiased.
In terms of the format, most companies that run NPS surveys use a clickable number range to collect answers. This allows respondents to submit their scores very quickly.
Because not everyone has a mathematical mind, it’s also a good idea to supplement your number range with visual cues. For example, you can use a color scale from red to green and include some smilies to show different moods.
Demographic questions
With the essentials out of the way, we can now start thinking about useful extras.
Unless you already know who is responding to every survey, it’s a good idea to include some basic demographic questions in your survey. The answers will allow you to break down NPS according to the type of respondent, and identify particular groups of customers who are happy or unimpressed customers.
Consider asking about age, gender, income, and location — although it’s a good idea to make these questions optional to maximize your response rates.
Other comments/feedback
Whenever you ask your customers for their opinion and they agree to participate, you should let them speak. In the context of an NPS survey, this means providing a section where respondents can add their own comments.
Whether the survey responses are positive or negative, any additional feedback is like gold dust. Not only are you learning how someone rates your brand or product — you’re learning why.
Permission to follow up
In some cases, you may come across a survey response that really catches your attention.
It might be because someone is super happy with your brand. It might be because they seem happy, and you want to feature them in a case study. Perhaps they suggested an interesting idea, or maybe they are just really unhappy and you want to make things right.
Whatever the reason, you may want to follow up, meaning you must seek permission. On your NPS form, include a checkbox for this, and have a field for the respondent's email address if needed.
Delivering your NPS survey
How you deliver your NPS survey is almost as important as the contents.
If all your customers are on your mailing list, sending out surveys via email is an obvious starting point. This channel works particularly well for relational surveys, and you can send different surveys to different segments (e.g. new customers vs loyal customers).
For audience surveys relating to your marketing, social media offers similar benefits. Just be aware that you will get some random people responding, which will mess up your data a little.
If you want to understand how your customers feel in the moment (i.e. transactional), you may want to consider running a pop-up on your website or within your app.
For instance, you could configure a message that will appear straight after someone leaves a chat with your support team, or right after they make a purchase.
How to improve your NPS score
Once you have built your surveys, gathered the data, and run your NPS calculation, you will have a figure to work with. Whether this is above average or low, it’s always worth trying to push your NPS higher.
Here are some steps you can take:
Adopt the Net Promoter System – Designed to work alongside the NPS metric, the Net Promoter System is a company-wide methodology that can help you deliver a better customer experience
Follow up with respondents – As we touched on previously, following up allows you to dive deeper into the reasoning behind why customers are happy or not
Try personalized surveys – Making your surveys more personal is a great way to encourage more responses, and it makes the data more specific
Make it up with Detractors – When an existing customer gives you a low score, attempt to find out why, and solve the problem
Use feedback for training – If customer service is the weak point, try to extract lessons from feedback and use this to train your staff
Improve your overall customer experience – Consider how you might make your services or support easier to access, and how you can add value to your product
How Sendbird can improve customer satisfaction and boost your app’s NPS
Want to know a shortcut for improving customer satisfaction in your digital product? Add omnichannel messaging features.
This could mean introducing asynchronous chat for support, or creating a social network that allows users to interact. Some businesses even adapt their entire app, so that users can send payments and access information through conversations.
All of these features improve the overall customer experience — and they are really easy to implement with Sendbird.
With our Chat API and SDK, you can add messaging features to your app in minutes. Our communications API platform handles over 7 billion messages per month, supporting the work of 145,000 businesses.
Talk to sales today to discover what Sendbird can do for your brand.