
22 mobile app KPI metrics you should be tracking


App analytics and mobile KPIs have never been more critical. Did you know that the average smartphone owner uses ten apps per day and thirty apps per month?
With millions of apps, from top third-party messengers to gaming to productivity and more, on the Apple App Store and Google Play Store, competition to acquire and retain users is fierce. “The Great App Explosion" is well underway.
Whether your app is your primary business or supports a broader digital or brick-and-mortar company, mobile app performance metrics, including monthly active users (MAU), average session length, and churn rate, are essential mobile KPIs to monitor for success.

8 major support hassles solved with AI agents
Why do you need to track mobile app KPIs?
Mobile apps offer an excellent way to connect with customers, increase engagement, and boost revenue, but having an app is just the beginning. The real challenge is making sure your app is successful.
To do this, you need to track a set of key metrics that provide an ongoing measurement of your app performance. This is where Key Performance Indicators (mobile app KPIs) come into play.
This blog post will discuss the 22 most important mobile app KPIs you should track as a mobile app owner, developer, or designer. We’ll divide the mobile app KPIs into Engagement, Performance, and Revenue.
What is a KPI?
Perhaps originating from France’s Tableau de Bord measurement system for process engineers in the mid-20th century—KPI stands for key performance indicator. It's a measurable value demonstrating how effectively a company is achieving a critical business objective.
Businesses use KPIs to evaluate their success in reaching targets and objectives at various levels. High-level KPIs may focus on overall business performance, while low-level KPIs may focus on processes in departments such as sales, marketing, HR, or support.
What is the value of tracking mobile app KPIs?
The value of tracking mobile app KPIs is to show objective evidence of progress towards achieving a desired result over time, such as app engagement, app sales, or effective customer support. So, if your business sets an overarching goal to grow profit in a single year by X%, each leader should set KPIs within their department to move workers toward that goal. In marketing, the KPI is to focus on maybe marketing-qualified leads (MQLs). In sales, it could be upselling.
Like any goal, for KPIs to work, they should be agreed upon by all decision-makers, clearly communicated to the entire team, and S.M.A.R.T. (specific, measurable, achievable, realistic, timely). Mobile app analytics and metrics are no different.
KPIs ensure that entire teams, large or small, are fully aligned on what’s essential and strive to grow toward the set targets each year. Let’s define a business goal and the corresponding KPIs to illustrate:
- Critical business goal: Grow profit in 2024 by 10%
- Marketing KPI: Marketing-qualified leads (MQL)
- Marketing KPI statement: Achieve a 20% growth in the number of MQLs over the next quarter/year
- Sales KPI: Upsells
- Marketing KPI statement: Achieve a 15% growth in upsells over the next quarter/year
- Customer support KPI: Ticket resolution time
- Marketing KPI statement: Reduce the average ticket resolution time by 17% over the next quarter/year
- Marketing KPI: Marketing-qualified leads (MQL)
Introduction to KPIs for mobile apps
Mobile app KPIs are a set of measurable parameters that help businesses track their app’s performance and measure success. By setting and analyzing their KPIs, companies can identify areas for improvement, optimize performance, and ultimately increase user engagement.
Any mobile app creator knows that measuring app metrics is necessary to understand whether their strategy is working.
While there are numerous KPIs you can track, it’s essential to start with a manageable set of indicators. Your app will have specific goals to focus on – the 22 KPIs included here provide a place to start when developing your initial set of mobile key performance indicators to track.
The 22 most important mobile app KPIs to track success
Chances are you’ve had or been asked questions like:
How is app adoption looking?
How has the app paid off since its launch?
What’s it costing us to grow the app user base?
You can’t answer these questions with guesses. The good news is there are many free and low-cost tools to measure your performance and readily answer these questions like Google Analytics–the most approachable analytics platform for tracking mobile app performance metrics–Mixpanel, Datadog, Fullstory, and more. We will cover tools shortly, but first, let’s discuss the mobile app KPIs you should track and what they measure.
Track the following KPIs to understand app adoption and overall performance, identify areas for improvement, and support your request for app development resources when it is time to build out new features.

Reimagine customer service with AI agents
22 Mobile app performance metrics (KPIs)
Engagement Metrics | Performance Metrics | Revenue Metrics |
| 1. Mobile app downloads | 12. Load speed | 16. App store conversion rate |
| 2. Monthly active users (MAU) | 13. Mobile app latency | 17. Average revenue per user |
| 3. Daily active users (DAU) | 14. Battery and network consumption | 18. Cost per install (CPI) |
| 4. Stickiness | 15. Crash/bug reports | 19. Time to first purchase (TTFP) |
| 5. Daily sessions per daily active user (DSDAU) | 20. Customer lifetime value (LTV) | |
| 6. Average session length (ASL) | 21. Cost per acquisition (CPA) | |
| 7. Average session depth (ASD) | 22. Return on investment (ROI) | |
| 8. Average retention rate (ARR) | ||
| 9. Average churn rate (ACR) | ||
| 10. Net promoter score (NPS) | ||
| 11. Uninstalls |
The most important engagement KPIs you need to know
There are different types of mobile app metrics to track. Engagement KPIs focus on user behavior. These metrics can be impacted by performance and drive Revenue KPIs, but they focus on specific user behaviors you want to achieve in your app.
Let’s cover the following mobile app KPIs:
Mobile app downloads
Monthly active users (MAU)
Daily active users (DAU)
Stickiness
Daily sessions per daily active user (DSDAU)
Average session length (ASL)
Average session depth (ASD)
Average retention rate (ARR)
Average churn rate (ACR)
Mobile net promoter score (NPS)
Uninstalls

[FREE TOOL] How does your app's engagement score compare to industry standards?
1. Mobile app downloads
What are mobile app downloads?
The first engagement mobile KPI to track is app downloads. Once the app is available via the Apple iOS or Android Google Play app stores, downloads can be seen. Determining whether you want to track downloads, installs, or both is important.
Note that the number of app downloads doesn’t give you insight into app performance as much as it does into marketing performance. Your marketing team should also track this key mobile marketing metric.

How to improve mobile app downloads:
To improve mobile app downloads, partner with your marketing team to drive installs using omnichannel notifications like SMS or WhatsApp. Partner with your growth team for a marketing campaign that prompts users to share the app with friends and see your downloads increase over time.
2. Monthly active users
What are mobile app monthly active users?
A person is a monthly active user (MAU) if they use your app at least once a month — or whatever 30(ish)-day period in which you’re measuring. You can measure this KPI based on people simply opening the app, or you can get more specific and count them only when they use a particular feature.
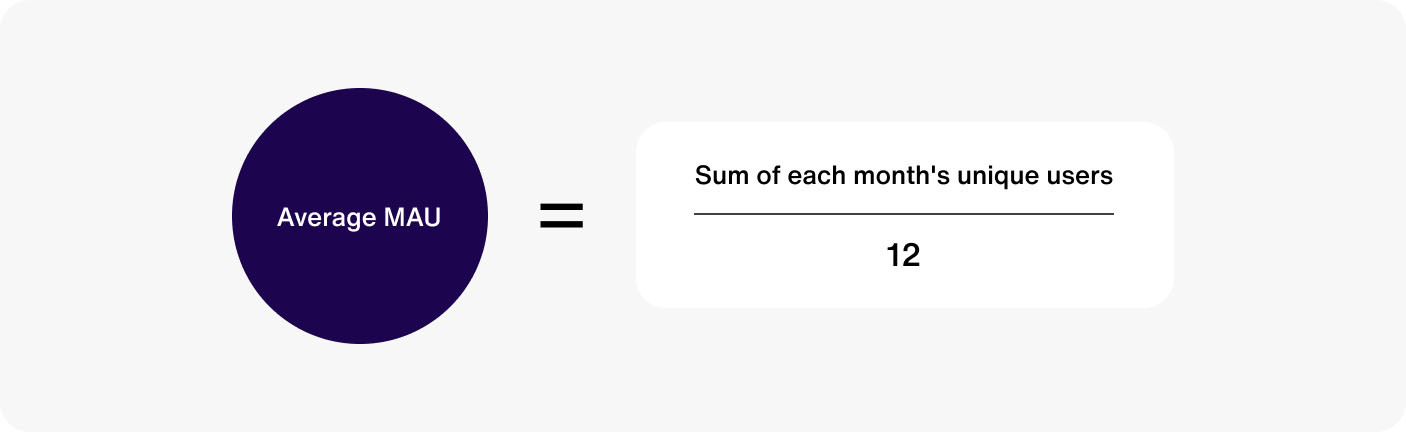
How many monthly active users your app has depends on so many things — app functionality, your marketing efforts, the type of people in your target market, etc. Instead of comparing your MAU KPI to other apps, it is often more helpful to focus on growth and making sure you have the number of users your app needs to support itself and turn a profit. Like app downloads, the monthly active user KPI gives a glimpse into general usage and growth so you can understand which trends or marketing strategies result in the adoption and keep moving in that direction.
How to improve mobile app MAU:
Increasing monthly active users can be achieved by ensuring your app provides value to your users continuously. In addition to providing value, you want to offer a hook that makes the user want to return. Using a Chat API can help drive users back to your app regularly as they wish to continue connecting with other users. Also, SMS Notifications and Push Notifications (see push notification examples) can drive inactive users back to your app. Monitoring user activity and sending a message to drive a user back to a specific experience or promotion is helpful.
3. Daily active users (DAU)
What are mobile app daily active users (DAU)?
DAU is a mobile app KPI measuring the number of unique users who engage with the product or platform daily. DAU is an important metric for assessing user engagement, product performance, and the overall popularity of an app or platform.
If your mobile app aims to create deep, engaged user sessions, daily active users (DAUs) is a pivotal KPI to measure. When people use your app every single day, you can rest assured knowing you have a useful and engaging product. Similar to MAUs, the best number of DAUs is one your app can sustain and, better yet, increase over time.
Another reason to track this metric is – that monthly and daily active users both feed into another critical KPI: stickiness. So, let’s cover that one next.

How to improve mobile DAU:
The techniques for increasing monthly active users also apply to increasing daily user activity. Real-time user experiences like chat, voice and video or interacting with an AI chatbot can increase daily user activity. While you don’t want to go overboard with SMS Notifications, WhatsApp Notifications, and Push Notifications, sending relevant communications to users outside your app on a semi-frequent basis can help you increase daily active users.
4. Mobile app stickiness
What is mobile app stickiness?
Mobile app stickiness refers to a mobile application's ability to retain users and keep them engaged over time. It's a measure of how frequently and consistently users return to the app after their initial download or usage. High app stickiness indicates that users find value in the app, enjoy it, and are likely to continue using it.
To determine how sticky your mobile app is for users, divide your daily active users by monthly active users. This formula shows how effectively your app converts a casual monthly user to an obsessed daily user. A stickiness of at least 20% is a good number to aim for.

How to improve mobile app stickiness:
To improve mobile app stickiness, you must understand how users get attached to your product. Then, do whatever you can to promote and play up that feature to keep users opening and sharing your app. Looking for more tricks to get even stickier? Add a social component to your app.
After all, products with a social element tend to stand out better from competitors, experience a self-sustaining growth loop, generate quality user engagement, and enjoy more stickiness.
To add a social element to your product, use a Chat API platform like Sendbird to easily layer chat for online communities into your app and create a sticky, native social experience.
5. Daily sessions per daily active user (DSDAU)
What are mobile app daily sessions per daily active user?
The metric "daily sessions per daily active user" (DSDAU) measures the average number of times a user engages with a mobile app within a single day per active user. It is calculated by dividing the total number of daily sessions by the number of active users (DAU) during the same period.

With the daily active users KPI, you aren’t necessarily measuring how many times a single user accesses your app throughout the day. So, this metric takes it further by digging into how often daily users engage with your app. If it interests you, you may also study session intervals or the time between sessions to understand the cadence at which folks are opening your app.
While it’s great to know that a group of people opens your app daily, we recommend looking even closer to see what they’re doing during these sessions. This can provide insight into which of your features are fan favorites — telling you where to spend your focus and budget.
It’s going to vary widely based on your target audience and your app’s functionality, but it may be helpful to note that the average number of sessions per user per day came out to two in recent years–so if you’re seeing a reduction in stickiness, you’re not alone.
How to improve the mobile app DSDAU:
To improve DSDAU, you need to bring users back to your app multiple times per day. They need a reason to return. This can be messages from other users, chatbots, business promotions, live chat, or voice and video real-time interactions. Focus on figuring out what types of messaging would bring users back to your app multiple times per day. Sometimes, a simple “you have a new message” push notification is all you need to do the trick.
6. Average session length
What is mobile app average session length?
The average session length is a metric that measures the average duration of time users spend actively engaged with a mobile app during a single session. It provides insights into how long users typically stay within the app before ending their session.
The deeper you get into mobile app KPI metrics, the more you realize how many of them are ultimately engagement metrics. This makes sense, as increased app engagement is often the catalyst behind users staying on your app, sharing your app, moving to a larger payment plan within your app, and many more actions that generate profit for your company.
Viewing session length is a quick way to determine the level of engagement within your app and whether or not you can expand on it to increase profit. If you have the time and your website analytics platform has the capability, you may even want to look at the related “session depth” KPI as well, which will uncover how close users get to critical features or conversion points (making a purchase, completing an upgrade, etc.).
In 2022, across verticals, the average time spent in-app per day was about 19 minutes. Determine the average session length by dividing the time of all app sessions by the total number of sessions. You can use tools like Google Analytics or Firebase Analytics to track session length.

How to improve mobile app session length:
To improve session length, you must ensure you provide enough value to keep users in your mobile app. Tracking session length can help you understand how engaged your users are and identify areas for improvement. If users spend a short amount of time in your app, it may indicate that you are not delivering on your value proposition.
7. Average session depth
What is mobile app average session depth?
Session depth, also known as depth of visit or pages per session, is a metric that measures the average number of pages or screens viewed by a user during a single session on a website or mobile app. It provides insights into how extensively users interact with the platform's content or features during a single visit.
The session depth metric in Google Analytics details the average number of pages a user visits during a single session on your website. Google determines this by dividing the total number of pageviews by the total number of sessions. For example, if a user visits 9 pages in one session, their session depth is 9.
session depth = total number of pageviews / total number of sessions |
How to improve mobile app session depth:
To increase session depth, focus on having a robust app with relevant content and strong navigation to move from one page to the next. With the limited screen real estate available in a mobile app, it can be hard to guide a user through an experience. By using in-app notifications, you can help users navigate to new content and improve session depth.
8. Average retention rate
What is mobile app average retention rate?
A mobile app's average retention rate measures how many people return to your app after installing it. You can measure retention over any time—weekly, monthly, yearly, etc. The Retention KPI is often used in the app space because it sheds light on the level of value and usability your app provides users. If you make a change and your retention rate rises, you’ll know you’ve positively impacted value and usability!
Measuring retention is a wise first step before conducting user testing to pinpoint what your target audience prefers. To measure average retention monthly, divide your monthly active users by your monthly app installs.
Average retention rate = |
How to improve mobile app retention rate:
App retention benchmarks vary widely by industry, but the average retention rate 30 days after a user installs your app hovers between 6% and 7%. If you see your retention rate slipping below that, there are a few strategies you can try to get users re-engaged:
Develop a mobile push notification, WhatsApp, or SMS messaging plan to inform users of interesting new offers and keep your app top of mind
Integrate in-app notifications or messaging with a Chat API or a Chat SDK to allow users to ask questions, request features, or voice concerns
Conduct onboarding user journey optimization to show new users value quickly, create a great first impression, and set realistic expectations
9. Average churn rate
What is mobile app average churn rate?
With churn rate, you measure how many users abandon or uninstall your app after a certain period. We recommend measuring churn over the same amount of time as retention, so if you measure retention in months, you should also measure churn in months.
Churn happens for various reasons. Often, this is due to the app not having the value the user expects, being hard to navigate, or adding new content, so the user loses interest. Three months after installation, the average churn rate of app users is 68%, so don’t worry if you see your churn stats around this benchmark. However, just like with retention, if you observe large churn rate swings right after a change to your app, dig into that and see if you can analyze the cause of the fallout.
Find your churn rate by taking 1 minus your average retention rate.

How to reduce mobile app average churn rate:
To reduce your churn rate, focus on understanding why your users are churning in the first place. If your app does not provide the value promised in marketing promotions or your users fail to find how to access that value, aim to match expectations to the value received.
You can conduct user research to determine if there is a misalignment between your app’s perceived value and what users get when they download and engage with the app. Through this research, you may also find issues with usability that you can improve. If the problem is a user is losing interest, consider adding in-app messaging to drive ongoing engagement.
10. Mobile net promoter score (NPS) and user satisfaction
What is the mobile app net promoter score?
The mobile app Net Promoter Score (NPS) is a metric used to measure customer loyalty and satisfaction specifically related to mobile apps or experiences. It is based on the Net Promoter Score (NPS) methodology, widely used in various industries to assess customer sentiment and loyalty.
NPS indicates how much (free!) word-of-mouth marketing your users are willing to do on your behalf. The more they do, the better off you are—because 90% of folks are likelier to trust a brand that’s been recommended personally.
Score 9-10: Ratings from nine to ten put users in the promoter category.
Score 7-8: Ratings from seven to eight put users in the passive category.
Score 0-6 and from six to zero put users in the detractor category.
Calculate your NPS by subtracting your percentage of detractors from promoters.
% of promoters – % of detractors = net promoter score |
The higher your net promoter score, the less time and money you should spend on marketing tactics. This will improve various other KPIs, so we wanted to kick things off with one of the most important KPIs on this list.
Would your users recommend your app to a friend? If your NPS is low, then it’s time to investigate why. Are your users unhappy with the user experience, app cost, or value they get from your app?
How to improve mobile app net promoter score:
To improve your mobile net promoter score, you can dive further using in-app surveys, customer feedback tools, app store reviews, or CSAT scores to understand how users perceive your app and give you valuable insight to improve and enhance features. In-app surveys can be triggered after a user completes a specific action or visits a particular screen. Customer feedback tools can provide a platform for users to submit feedback and complaints directly to your customer support team.
Ready to take your NPS to new heights? Upgrade your customer service management strategies and live support chat to ensure users find value and achieve their goals.
11. Uninstalls
What are mobile app uninstalls?
"Uninstalls" refers to removing or deleting a software application, such as a mobile app or computer program, from a device. When a user uninstalls an app, the application is no longer installed on their device and is removed from their system completely.
In the context of mobile apps, tracking uninstalls is an important metric for app developers and businesses. It indicates the number of users who have chosen to remove the app from their devices due to dissatisfaction, lack of use, or other reasons. Monitoring uninstall rates helps businesses understand user behavior, identify potential issues with the app, and make improvements to enhance user retention and engagement.
Specific app categories like dating and gaming are notorious for uninstalls. Dating, for example, has an uninstall rate of 65 percent. Understanding the benchmark uninstall rate for your industry gives you a good starting point for tracking how your app is performing.
You can send silent push notifications or install the appropriate SDKs for iOS and Android to track app uninstalls. Most users uninstall apps because they are not in use, so ensuring your app has a reason to actively engage regularly can help you reduce the uninstall rate. Adding chat and/or business messaging gives your users reasons to return repeatedly.
How to improve mobile app uninstalls:
By creating a sticky app with a good customer experience, it is more likely you will beat the average uninstall rate. Make sure your app has an easy-to-find live support chat so you can help users who are confused or unable to find what they need in your app. As noted above, some industries are notorious for high uninstall rates, so make sure you understand your industry uninstall benchmark before worrying about losing users. However, if your cost per user acquisition is high, you’ll want to focus on how to decrease your uninstall rate.
Four mobile performance metrics you should track
Unlike engagement and revenue metrics, performance mobile metrics focus on how your app is technically performing. While they do not directly drive engagement or revenue, poor app performance will result in reduced engagement, increased churn, and poor ROI.
While there are many performance KPIs your engineering team should be tracking and optimizing at all times, this post covers a few primary ones that you can check to ensure that your other KPIs are not being negatively impacted by backend technical issues.
Mobile app performance metrics
Load speed
Mobile app latency
Battery and network consumption
Crash/bug reports
12. Load speed
What is mobile app load speed?
Mobile app load speed refers to the time it takes for your mobile app to load after a user launches it. In today’s fast-paced and ever-changing world, users demand quick and seamless app experiences. Slow load times can frustrate users and drive them away from your app, resulting in lost revenue and poor user retention.
You can use tools like Google PageSpeed Insights or WebPageTest to track load speed. Apptentive found that over 30% of developers will make load times their top performance goal in 2023.
Industry benchmarks for app load speed vary depending on the app’s functionality and purpose. The average load time for mobile landing pages across industries is 22 seconds. Yet, 53% of mobile site visitors leave a page that takes longer than 3 seconds to load.
How to improve mobile app load speed:
According to BitCot.com, to improve app load speed, use efficient code practices, optimize images and media content, leverage caching techniques, utilize asynchronous loading, and improve server response times.
If you use any third-party APIs in your mobile app, ensure they are best-in-class and tested for load speed.
13. Mobile app latency
What is mobile app latency:
Mobile app latency is measured by how long it takes for a request to respond. The acceptable response time for a mobile app is two to three seconds. Users will likely churn if your app does not perform to this standard.
Ping tests measure the round-trip time (RTT) between a mobile device and a specific server or IP address to measure mobile app latency.
How to improve mobile app latency:
To improve your mobile app latency, minimize the number of network requests that your app makes and optimize your images and video. Network issues, server issues, inefficient code, too much data, device issues, and external factors can all slow down your app.
To distribute content to users faster, use a distributed database or caching system and a content delivery network. If your response time is slower than two to three seconds, talk to your engineers about other ways to improve your app latency.
14. Battery and network consumption
What is mobile app battery and network consumption?
Mobile app battery and network consumption refer to a mobile app's impact on a device's battery life and network data usage when it is running. These are important metrics to consider when developing and optimizing mobile apps to ensure they are efficient, user-friendly, and do not drain device resources excessively.
We all know how frustrating it is when our mobile batteries drain faster than they should. App developers need to focus on how much battery and network consumption their apps use.
You may not always know that your app is using the network inordinately while running in the background. If you have already published your app, Android vitals can help you understand the problem you need to fix. Apple offers a similar tool called MetricKit to monitor network usage.
How to improve mobile app battery and network consumption:
Benchmarking your app’s battery use in a controlled environment helps you understand the battery drain your app causes. For Android apps, Batterystats is a tool included in the Android framework that collects battery data on your device. You can use adb to dump the collected battery data to your development machine and create a report you can analyze using Battery Historian. Battery Historian converts the report from Batterystats into an HTML visualization you can view in your browser.
15. Crash/bug reports
What are mobile app crash/bug reports?
Mobile app crash/bug reports refer to the feedback or notifications generated when an app encounters errors, crashes, or malfunctions while running on a mobile device. These reports provide valuable information to app developers and support teams, helping them identify and address issues to improve app stability and performance.
Every app crashes occasionally, but apps that frequently crash are more likely to be uninstalled by users, negating all of the investment you put into acquiring them in the first place. You want to monitor how often your app is crashing and experiencing bugs and work closely with your engineering team to improve these KPIs.
How to improve mobile app crashes and bugs:
Make sure you use a digital experience monitoring (DEM) system that monitors the availability, performance, and quality of app user experiences to identify and resolve technical and performance issues. While your app WILL crash, knowing when it happens in real time and being able to resolve it as quickly as possible will save you from numerous bad reviews and uninstalls.
The most critical revenue metrics for your mobile app
Revenue metrics focus on the value your app is generating for business. They also look at the cost of user acquisition, which informs other revenue metrics like ROI. For most mobile apps, tracking revenue metrics is necessary to validate the investment in developing and maintaining the app.
Each vertical has unique revenue metrics to track. This post focuses on metrics that apply to most mobile apps. For vertical KPIs, focus on understanding your goals (e.g., subscriptions, upsells, and cross-sells) and adding a few KPIs that help you benchmark your success for your industry.
16. App store conversion rate
What is mobile app store conversion rate?
The mobile app store conversion rate refers to the percentage of users who download and install an app from the app store after viewing its listing or page. It is a key performance indicator (KPI) used by app developers and marketers to measure the effectiveness of their app store optimization (ASO) efforts and the attractiveness of their app to potential users. This is easier to track than install rates, which is a similar metric but includes visitors who saw your app outside the app store.
According to AppTweak, the average conversion rate in the US App Store is 31 percent, though this varies by category. Google Play conversions are around 32.7 percent.
Conversion rate = Number of App Installs / Number of App Store Page Views *100 |
How to improve mobile app store conversion rate:
To increase your app conversion rate, partner with your growth marketing team to ensure your app description and images showcase the best features. Use different creative content for each app store, optimize your screenshot gallery, and provide clear messaging in your app store profile. Also, you can encourage users to share reviews with in-app or push notifications, SMS, or WhatsApp messages. Positive reviews are essential for businesses to sell their products, with customers willing to spend 31% more on a company with excellent reviews.
17. Average revenue per user (ARPU)
What is mobile app average revenue per user?
ARPU stands for Average Revenue Per User. It is a key metric businesses use, particularly in the telecommunications, media, and subscription-based industries, to measure the average revenue generated per customer or user over a specific period. ARPU is an important indicator of a business's financial health and performance, as it provides insights into each user's revenue-generating capabilities.
Average revenue per user (ARPU) is calculated by dividing the total revenue generated in a time period (such as monthly, quarterly, or annually) by the total number of active users over that same time period. It helps you determine if you are making enough revenue per user. This fundamental KPI is essential for apps that offer in-app purchases. Mobile gaming KPIs focus on ARPU, for example.
ARPU = Total Revenue / Number of users |
It is especially useful to track ARPU if your business is based on subscribers or active users, not physical products. ARPU can include subscription costs, upsells, and cross-sells.
How to improve mobile app average revenue per user:
To increase ARPU, encourage your users to sign up for subscriptions and use your app real estate to promote upsell opportunities. One way to do this is using in-app business messaging. An Ecommerce AI chatbot can also drive in-app purchases, increasing ARPU. You can also use in-app customer support chat to offer targeted promotions to your users, increasing ARPU.
18. Cost per install
What is mobile app cost per install?
Cost per install (CPI) measures the money spent acquiring one new user to install your app. CPI helps businesses understand the effectiveness and efficiency of their mobile user acquisition campaigns. By monitoring CPI, you can optimize your ad spend and improve your return on investment (ROI). If your CPI is too high, it may indicate that your ads are not targeting the right audience or that your app store optimization needs improvement.
To calculate CPI, divide the total cost of your user acquisition campaigns by the number of installs generated by those campaigns.
CPI = Total ad Spend / Number of installs |
For example, if you spent $1,000 on a campaign that generated 500 installs, your CPI would be $2.
CPI = $1000 / 500 = $2 |
Industry benchmarks for CPI vary depending on the app’s purpose and functionality. The average CPI for mobile apps across all industries is around $3.21 for iOS and $1.51 for Android.
How to improve mobile app cost per install:
To reduce cost per install, ensure your growth marketing team properly promotes the value your product provides to the right audience. A user may download your app and never install it if they forget that they downloaded the app. Making a memorable app store experience that highlights high-value “must-try” features is key.
19. Time to first purchase (TTFP)
What is mobile app time to first purchase?
Mobile app Time to First Purchase (TTFP) is a metric that measures the amount of time it takes for a user to make their first purchase after installing a mobile app. It is an important metric for businesses, particularly those in e-commerce, subscription-based services, and mobile gaming, as it provides insights into user engagement, conversion rates, and the effectiveness of onboarding and monetization strategies.
The formula to calculate Time to First Purchase (TTFP) is:
TTFP = Time of First Purchase – Time of App Installation |
For example, if a user installs a shopping app on January 1st and makes their first purchase on January 10th, the Time to First Purchase would be 9 days.
Key points about time to first purchase (TTFP):
User engagement: TTFP reflects user engagement and interest in the app's offerings. A shorter TTFP generally indicates higher user engagement and a more compelling user experience that encourages early conversions.
Monetization: For businesses focused on monetization, reducing TTFP is crucial as it accelerates revenue generation and improves the app's return on investment (ROI). Strategies such as personalized offers, incentives, and in-app promotions can help shorten TTFP and drive conversions.
Onboarding optimization: Optimizing the app's onboarding process, user interface, navigation, and checkout experience can contribute to a shorter TTFP by reducing barriers to purchase and making it easier for users to explore and transact within the app.
Retention and lifetime value: TTFP is linked to user retention and lifetime value (LTV). Users who purchase early in their app journey are more likely to become repeat customers, contribute to higher LTV, and positively impact overall app revenue.
Segmentation and Analysis: Analyzing TTFP across different user segments (e.g., new users vs. returning users, different user cohorts) helps businesses understand user behavior, identify conversion bottlenecks, and tailor marketing and engagement strategies accordingly.
By monitoring and optimizing Time to First Purchase (TTFP), businesses can enhance user engagement, increase conversion rates, drive revenue growth, and improve app performance and profitability.
Time to first purchase is a metric that can also be tracked using Google Analytics or Firebase Analytics.
How to improve mobile app time first to purchase:
Focus on the user experience first to reduce the time to purchase. You can use in-app surveys to understand why users abandon their carts when they begin a purchase. Also, conduct broader market research to understand what users want to pay for and how much they are willing to pay for these features or products.
20. Customer lifetime value (LTV)
What is mobile app customer lifetime value?
LTV stands for Customer Lifetime Value. It's a metric that represents the total value a customer brings to a business over the entire relationship duration. This value includes all the purchases, subscriptions, in-app purchases, shares, or transactions the customer makes during their engagement with the business. Understanding the LTV KPI is important for showing your app's profit-generation potential and reining in your marketing budget. When you know a user's total LTV, you know where to stop when it comes to CPA spending. Calculating LTV helps businesses understand the long-term revenue potential of their customer base and make informed decisions regarding customer acquisition, retention, and marketing strategies.
Your lifetime value will depend wholly on your acquisition costs and opportunities for generating profit within your app. However, we can tell you the ideal LTV/CPA ratio is 3:1 or higher. If your LTV for a new user far exceeds the cost of acquiring them, congrats — you’re crushing it!
To determine customer LTV, multiply ARPU (average revenue per user — ad revenue, purchases, etc.) times (1/avg. churn rate).

How to improve mobile app customer lifetime value:
To increase your LTV, maintain regular customer communication, actively solicit feedback, offer quick support, or implement a customer loyalty program.
21. Cost per acquisition (CPA)
What is mobile app cost per acquisition?
CPA is a mobile app marketing KPI that takes into account all the costs associated with converting a lead into a new customer—aka, acquiring them. It’s very similar to customer acquisition cost (CAC), which measures the cost of acquiring a paying customer specifically. If this distinction is important to make within your app, you can measure both KPIs.
On average, the cost per install of an app is $1.75 USD, but getting a user to make their first purchase in-app can run you $87 USD. Once you understand what it takes to acquire an app user, you’ll be able to hone in on the specific segments and campaigns that create the most profit in comparison to spending. To find the cost per user acquisition, divide the costs associated with a particular campaign by the number of acquisitions that specific campaign generated.
How to improve mobile app cost per acquisition:
To reduce CPA, you must focus on reducing your marketing costs and understanding why users aren’t downloading your app. Start by leveraging partnerships and referrals. The more you can leverage your existing users to promote your app to their friends and drive viral downloads, the lower your CAC will be.
22. Return on investment
What is mobile app return on investment?
Return on investment (ROI) measures the amount of money an investment generates over the amount spent on that investment. In your case, we’re discussing investment in mobile app development, upkeep, and marketing.
Find ROI by subtracting the investment cost from the profit generated by the investment and dividing that number by the cost again. You'll get a negative number if your return is less than your spend. Of course, you want your ROI to be positive, indicating that your app investments are profitable.
Monitoring ROI on a regular basis is crucial to your app’s success. It’s one of the most visible ways to indicate that it’s growing in profitability over time, which is important for planning and proving your progress to stakeholders.

How to improve mobile app return on investment:
To increase ROI, improve the other mobile metrics in this post. Reducing your CAC for user acquisition and growing user engagement and retention can dramatically improve your ROI.
How to engage and retain more users with in-app notifications
Boost your mobile app KPI metrics with enhanced customer communications
Improving your mobile app KPIs requires dedicating time and resources to creating an engaging, sticky experience in your app. You can achieve your goals for app engagement, revenue, and beyond by adding chat, business notifications, and AI agents.
Power your app with integrated communication capabilities for marketing, sales, and support using the Sendbird communications API platform. Explore our SDKs, UIKits, webhooks, and tools—built for developers and ops teams ready to elevate the customer experience.
Mobile App KPI FAQs
What is a Mobile App KPI?
Mobile app KPIs are a set of measurable parameters that help businesses track their app’s performance and measure success. By setting and analyzing your KPIs, companies can identify areas for improvement, optimize performance, and ultimately increase user engagement.
How should I measure the success of my mobile app?
Any mobile app creator must select a set of core KPIs to track to measure the success of their mobile app. Select 10-20 mobile app KPIs to measure the success of your mobile app.
What is a KPI for mobile app performance?
A KPI for mobile app performance is a key performance indicator that measures specific goals for your mobile app. These can be leading or lagging indicators that your app is performing to your standards of success.
How many KPIs should I track for my mobile app?
While there are hundreds upon hundreds of KPIs you can track to measure the success of your mobile app, we recommend selecting 10-20 to start, plus 5-10 that are vertical-specific for your industry. It is usually better to set up tracking mechanisms for more KPIs but to select a smaller handful to improve so you can benefit from notifiable changes instead of feeling overwhelmed by too many KPIs. In a larger company with more resources, you can focus on a more significant number of KPIs.