
21 key e-commerce metrics every store owner should track


In e-commerce, success depends on how well you understand the data that tracks your online store’s performance.
Compared to other industries, e-commerce provides exceptional visibility into customer satisfaction, campaign performance, and user engagement. You need a good strategy backed with accurate KPIs and metrics to measure your success and learn from your mistakes.
In this guide, we’ll go over:
The most critical e-commerce metrics you can use to set and track key performance indicators (KPIs)
Formulas you can use to calculate these metrics
Examples of the insights they can provide into your business in this changing marketplace.
Let’s start by talking about why tracking e-commerce metrics is so important to your online retail business.
Why measuring e-commerce metrics and setting KPIs is important
Metrics are the raw data. They offer valuable insights into the number of people that convert into customers, the average value of each customer’s orders, and how much a customer will spend in the long term.
Understanding the top e-commerce metrics is crucial in shaping your online store's success and plans.
Armed with this data, your business can make informed decisions about its overall performance and customer engagement strategies. Based on these metrics, you can also set KPIs (key performance indicators).
In general, you should set KPIs aligned with your business goals.
For example: Your goal may be to increase online sales by $1 million annually. To measure your progress toward this goal, you would set KPIs that would measure metrics relevant to that goal, such as total revenue, number of sales, and the customer conversion rate.
E-commerce metrics to track for store owners
The metrics you should track on your e-commerce store depend on what product you sell, your industry, and your business goals. First, you can identify those metrics that help you understand your operations and customers and how they change over time.
By tracking this data and comparing it to previous periods, you can identify trends and changes that provide insights into what’s working and what’s not, what has changed, and what you need to change.
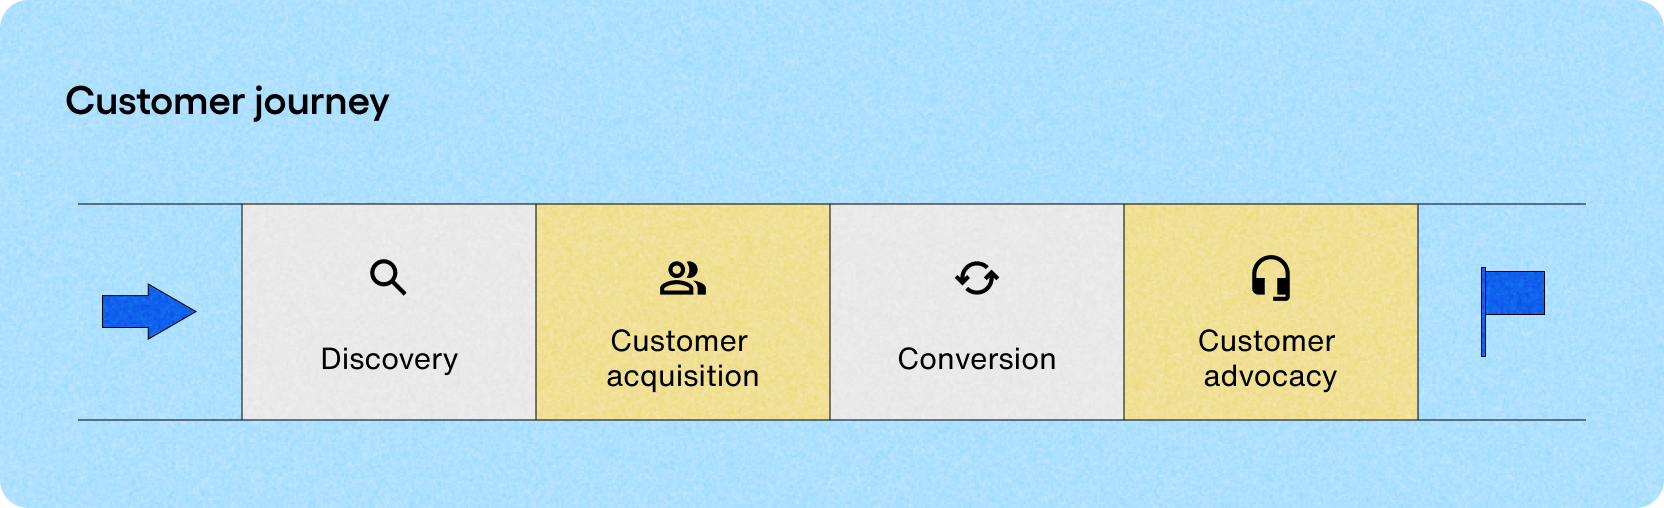
We can break the key metrics in e-commerce into four categories based on which stage of the customer journey they measure:
Discovery
Customer acquisition
Conversion
Customer advocacy
These categories help you narrow down which metrics you should focus on. For example, if your website traffic levels are dropping, you should look at discovery metrics to see how your SEO and marketing efforts are performing.
E-commerce metrics: Discovery
Discovery metrics measure the performance of your marketing and SEO strategies in raising awareness of your brand and attracting visitors to your website.
1. Impressions
An impression is any time someone sees your brand on a screen, whether through an online ad, video, blog post, or another type of content, whether or not they see it or interact with it.
Impressions contribute to awareness and discovery, i.e., how people find, learn about, and decide to buy a product or service on your website. Your analytics should include overall impressions for your campaign or specific impressions for a single ad or piece of content.
2. Reach
Reach measures the total number of unique users who see your ad or content. Unlike impressions, reach measures people who actually see your content and doesn’t count multiple views by the same person. Reach helps you understand the scope of your audience, and, combined with impressions, lets you measure the effectiveness of your marketing efforts.
3. Engagement rate

Engagement, or engagement rate, measures user interaction with your ad or content. Engagement can consist of likes, opens, comments, shares, clicks, or more, depending on the delivery platform. e-commerce analytics tools (like Google Analytics) can measure engagement levels. You can calculate the engagement rate by dividing total engagement by social media followers or impressions:
Engagement rate = Total engagement / followers (or impressions) X 100
Automated customer engagement e-commerce platforms are an excellent way to boost engagement rates by building meaningful user connections.
Customer acquisition
Customer acquisition metrics measure the effectiveness of your marketing efforts in attracting users to your website and what those users do when they first arrive at your site. These include e-commerce engagement metrics that measure how your marketing efforts and website encourage users to interact with your site and continue the user journey to a sale.
4. Organic acquisition traffic
Ideally, you want to attract people to your website without paying for it, i.e., through targeted ads or other channels. Organic acquisition traffic measures the number of visitors who visit your site through search engine results or other “organic” means, like typing your URL into their browser. It’s a measure of the effectiveness of your SEO and content marketing efforts and an excellent indicator of the strength of your brand because it measures users actively seeking your product or service.
Investing in a solid SEO and content marketing strategy can improve organic acquisition traffic levels.
5. Cost per acquisition (CPA)

Cost per acquisition, or customer acquisition cost (CAC), is the cost of acquiring a customer from a specific marketing or advertising campaign. It can measure the cost of acquiring a paying customer or encouraging a user to take action, like subscribing to a newsletter or registering as a customer.
To calculate the CPA, divide the total cost of the marketing campaign (or total marketing efforts) by the number of customers acquired via the campaign:
Cost per acquisition = Total marketing campaign costs / # of customers acquired through the campaign
CPA can help you optimize your marketing campaigns by identifying the most and least practical marketing activities. You can also compare CPA to the customer lifetime value (CLV, see below) to determine the profit ratio of your marketing efforts. For example, if your CLV is lower than your CPA, your marketing campaign is running at a loss and may not be sustainable in the long run.
To calculate total marketing campaign costs, consider these elements:
Labor costs (salaries)
Marketing software subscriptions
Agency fees
Ad spend
Pay-per-click advertising
You may also want to allocate a percentage of your e-commerce store costs (hosting, e-commerce software, etc.) to the CPA calculation to represent the total cost to acquire a customer accurately.
6. Bounce rate
The bounce rate is the percentage of first-time visitors who navigate away (or bounce) from your site after viewing a single page or taking any action. The average bounce rate for e-commerce or retail websites is 20 - 45%, which means that between one-quarter and one-half of visitors to your site will leave without doing a thing.
The bounce rate can also vary by traffic source, with high-engagement sources such as word-of-mouth referrals and email campaigns experiencing lower bounce rates than other marketing channels.
To reduce your bounce rate, make your website and product pages attractive and engaging so users are encouraged to interact immediately with your brand and move along the user journey to conversion.
Conversion
E-commerce conversion metrics are arguably the most important indicators of your online store’s performance because they measure actual e-commerce sales and buyer behavior.
7. Sales conversion rate

The sales conversion rate is one of the most essential e-commerce metrics. It measures the percentage of visitors to your website who complete a purchase. Even a slight change in the sales conversion rate can indicate a significant change in total sales.
To calculate the sales conversion rate, divide the total number of completed transactions by the number of site visitors.
Sales conversion rate: Total transactions / total site visits X 100
The average e-commerce conversion rate is 1.82%. You may want to calculate and track the sales conversion rate for specific products or product categories to provide a more accurate metric for your online store. This lets you gauge if they’re worth investing in marketing resources to drive more category traffic. You can also positively impact the sales conversion rate by optimizing the user journey and shopping process and tracking other conversion metrics to see where customers may be dropping out of the sales process.
8. Shopping cart abandonment rate
The shopping cart abandonment rate is how often customers add products or services to their online shopping cart but leave your site before visiting the checkout and finishing the purchase. The average shopping cart abandonment rate is 70%, meaning almost three-quarters of visitors come to your store, select something, and leave without buying it. The shopping cart abandonment rate soars to an average of 85.6% for mobile users.
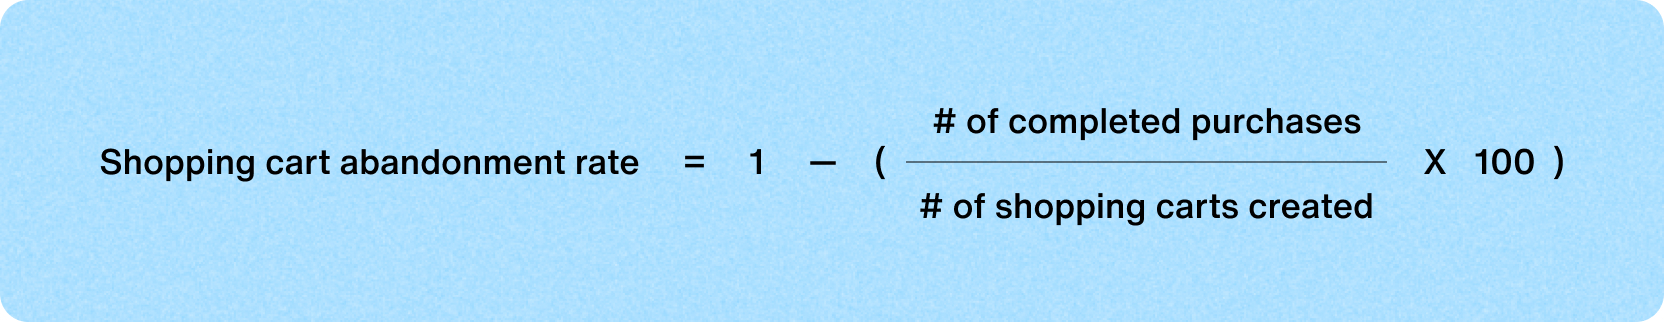
To calculate the shopping cart abandonment rate, divide the number of completed purchases by the number of shopping carts created and multiply by 100 to get the cart conversion rate. Then subtract the cart conversion rate from 1 to get the shopping cart abandonment rate.
Shopping cart abandonment rate = 1 - (# of completed purchases/# of shopping carts created X 100)
A higher-than-average shopping abandonment rate could indicate several problems, including a poor checkout experience or low customer engagement. Fixes include optimizing your checkout process and improving engagement with enhanced customer support at the checkout. Also, consider re-engagement strategies like emailing or notifying users who abandoned their cart to remind them they didn’t complete their purchase and asking if there’s anything you can do to help them.
9. Checkout abandonment rate
The checkout abandonment rate is similar to the shopping cart abandonment rate, except it measures customers who enter the checkout process and enter their payment information but leave before finishing their purchase. The average checkout abandonment rate is similar % to the shopping cart abandonment rate of 70%.
You can calculate the checkout abandonment rate by dividing the number of completed purchases by the number of checkout processes and multiplying by 100 to get the checkout conversion rate. Then subtract the checkout conversion rate from 1 to get the abandonment rate.
Checkout abandonment rate = 1 - (# of completed processes/# of checkout processes started x 100)
A high checkout abandonment rate is usually caused by something that causes customers to change their minds about the purchase. Almost half of all checkout abandonments are caused by high extra costs (shipping, tax, extra fees), so make your checkout process as transparent as possible to avoid nasty surprises. It also helps to invest in digital customer support solutions to increase engagement during checkout.
10. Average order value (AOV)
The average order value is the total of every order placed in your store over a set period. It provides insight into how much you can expect the average user to spend on your site in a single transaction.
You can calculate the AOV by dividing the total sales value by the number of completed purchases.
Average order value (AOV) = Value of all purchases / # of completed purchases
If you know (or can estimate) your average costs for each purchase, you can use the AOV to estimate the average profitability of your online store. You can increase the AOV (and profit margin) by upselling accessory items or services or recommending associated products while the user is shopping. If you can track purchases by category, you can also calculate the average order value by category to provide a more granular view of your store’s profitability.
Retention metrics
Retention metrics measure how well your e-commerce website retains long-term and short-term users. They help forecast long-term revenue and provide valuable insights to guide your business growth strategy and loyalty programs.
11. Customer retention rate (CRR)
The customer retention rate measures how well your online store maintains its customer base over some time. CRR varies by industry, so it’s best to research the average rate for your industry.
To calculate the customer retention rate for a specific period, subtract the number of customers acquired from the number of customers at the end of the period and divide by the number of customers at the start, then multiply by 100.
Customer retention rate = ([# customers at end of period - # of customers acquired during period]/# customers at start of period) x 100
Factors like trust, customer service, community, and values affect the CRR. One effective tactic to improve the CRR is to improve engagement via customer conversations.
12. Customer lifetime value (CLV)
CLV measures the total revenue your store will earn from an average customer when they remain a customer. It’s a great way to forecast future revenues and guide your customer acquisition and retention strategy.
Calculate CLV by multiplying the average order value (AOV) by the average customer purchase frequency for a set period (for example, a single quarter). Then multiply by the number of periods your store retains an average customer.
Customer lifetime value = (Average order value for period A x Average customer purchase frequency for period A) x total number of periods an average customer is retained
Your CLV increases by an increase in any of these three variables, so strategies to increase order value, purchase frequency, and customer retention will increase CLV. Note that the most significant increase comes from how long a customer is retained, so it’s wise to invest in solutions and strategies that increase customer satisfaction, engagement, and retention.
13. Repeat/returning customer rate
The repeat customer rate measures the percentage of customers who return to your store to make additional purchases. The average repeat customer rate for e-commerce stores is 28.2%.
To calculate the repeat customer rate, divide the number of customers who make two or more purchases by the total number of customers and multiply by 100.
Repeat customer rate = (# customers who make 2 or more purchases/total # customers) X 100
Engaged customers are more likely to return for a second purchase, so it's a good idea to invest in making the initial purchase a positive user experience and engaging customers post-sale to increase their engagement with your store.
14. Return and refund rate
The refund and return rate is the percentage of customers who have returned products for a refund. It is calculated by dividing the number of returns your store accepts in a period by the total number of products sold and multiplying by 100.
Return and refund rate for period A = (# goods returned for refund in period A / total # of goods sold in period A) X 100
A high return and refund rate could indicate problems with product quality or unmet/mismatched customer expectations. Since some product returns are inevitable, having a clear and transparent returns policy is important to retain first-time buyers who may return a product. It’s also important to ensure a consistently high level of customer support to make the return process as simple and painless as possible.
15. Churn rate
The churn rate measures the number of users or customers your store loses. It’s a valuable metric for all e-commerce businesses, particularly subscription-based businesses because it measures long-term engagement and retention.
To calculate the churn rate for a set period, divide the number of customers lost by total customers at the start of the period and multiply by 100.
The churn rate for period A = (# customers lost during period A / total # of customers at the start of period A) x 100
Measuring the churn rate regularly lets you stay on top of customer retention and quickly spot and narrow in on issues causing customers to leave your business. It also lets you know how many new customers you must attract every period to cover the number of customers who leave.
Advocacy and engagement metrics
Advocacy and engagement metrics how engaged customers are with your business and how much they promote your products and services via social media, reviews, and communities.
16. Net promoter score (NPS)
The net promoter score measures how likely a customer is to promote or detract from your brand or products on a range of one to ten. NPS scores are usually sorted into three categories by score:
Promoters (9 - 10) – happy, likely to recommend your product or service to others and remain loyal to your brand.
Passives (7 - 8) – neutral, unlikely to make a recommendation. You may become repeat customers but also be open to offers from your competitors.
Detractors (0 - 6) – unhappy, may warn others against using your product or service. Unlikely to interact with your business again unless they have no other option
You can calculate NPS by surveying customers on how likely they are to rate your business on a scale of one to ten. Then subtract the percentage of detractors from the percentage of promoters.
NPS = % of promoters - % detractors
Since promoters account for more than 80% of referrals and detractors account for more than 80% of negative reviews and word of mouth, tracking your NPS and investing in improving customer experiences and satisfaction is crucial.
Other e-commerce metrics
Other e-commerce metrics can provide valuable insights into your business and guide your acquisition, conversion, and retention strategy.
17. Store sessions by traffic source
Shopify and other e-commerce sites provide this metric to break down the number of visits to your website by where visitors come from, including organic search, social media, paid search, email marketing, or direct visits. This information helps you guide your marketing efforts by identifying which channels are performing and which might need extra attention.
18. Store sessions by location
Similarly, store sessions by location track website visitors by geographical location. Combined with store sessions by traffic source, it provides a granular view of your marketing channels' performance. It’s an excellent metric for understanding customer demographics and setting strategies for shipping and localization.
19. Store sessions by device type
Store sessions by device type measure visitors to your site by what device they are using (mobile, desktop, other). Besides providing useful demographic information, it also helps you optimize your store experience by device. For example, if most of your visitors are from mobile devices, you should consider adding functionality to improve engagement with mobile users.
20. Inventory
Inventory metrics measure how much product you have available on hand to sell. Measuring inventory lets you avoid out-of-stock situations and when to order or produce more products.
21. Top products
Top products rank your products by the number of units sold or revenue generated in a period. It helps you identify popular products and make pricing, marketing, and inventory decisions.
Why track e-commerce metrics?
Tracking e-commerce metrics is crucial as they offer valuable insights into the performance and health of your store.
These metrics are more than just numbers; they are like vital signs that help you understand how your business is doing. Here are three reasons why you should consider tracking e-commerce metrics:

Communicate seamlessly with buyers.
Grow a bigger, better business
To grow your e-commerce business, it's important to track metrics that can help you identify areas for improvement. For instance, analyzing traffic sources can show you which marketing channels drive the most traffic and conversions.
Additionally, metrics like sales conversion rates and average order value can help you evaluate the success of your sales techniques. If these numbers are low, you may need to adjust your approach by improving product descriptions or utilizing upselling and cross-selling methods.
Establish KPIs for each department to achieve your business goals that align with your overarching objective. KPIs should be specific, measurable, achievable, realistic, timely, and agreed upon by all decision-makers. By analyzing and acting on e-commerce metrics, you can optimize your business operations, increase your profits, and grow your online business more effectively.
Make data-driven decisions
To stay competitive, you must have the right data at your fingertips to make the right decisions. For example, a high shopping cart abandonment rate may indicate an issue with your checkout process. By gathering and analyzing the right data, you can identify a problem (like a confusing user interface or high shipping costs) and quickly make the necessary adjustments. Then, you can monitor your site metrics to measure the results and make further improvements if needed.
Similarly, knowing your customer lifetime value is important for making effective business decisions, such as determining the appropriate amount to invest in customer acquisition and retention. Using data-driven insights rather than relying on intuition leads to decisions that will benefit your business in the long term.
Understand customers better
By tracking e-commerce metrics, you can gain valuable insights into your customers' behavior. Metrics such as product discovery, reach, and engagement can help you understand how customers find and interact with your products. Demographic data can also provide insights into your customers and how you can attract them to your business.
Metrics like net promoter score and customer retention rate can also help you gauge customer loyalty. Understanding these factors can help you adjust your offerings and marketing strategies to meet your customers' needs and preferences better, ultimately increasing customer satisfaction and sales.
Improving key e-commerce metrics with Sendbird
Whether you operate in the tech space or want to provide a better customer experience through your digital channels, Sendbird can help. We're the leading communications API platform.
Our Chat API helps you implement feature-rich asynchronous messaging and support in any app, with built-in translation and moderation. Deliver a consistent brand experience that immerses customers in your brand. Here’s how we can help:
Provide quick customer service and support through real-time chat and communication to improve conversion rates and engage users.
Improve the shopping experience by allowing customers to ask questions and receive personalized recommendations in real time.
Boost loyalty and customer retention by fostering a sense of community with prompt and efficient customer service enabled by real-time communication.
Generate valuable customer data through conversation analysis to improve services and products and gain valuable insights.
Sign up today to start your free trial, or talk with our sales team to discover how Sendbird Chat can boost your e-commerce metrics in weeks.